Solana Price Surges 5% As SOL ETFs Defy The Crypto Crash With 20 Consecutive Days Of Inflows

The Solana price surged 5% in the past 24 hours to $135.74 as of 4:54 a.m. EST on trading volume that soared 19% to $5.5 billion.
This jump in the SOL price comes as US spot Solana ETFs (exchange-traded funds) continue to defy the crypto crash, reporting their 20th consecutive day of net inflows, according SoSoValue.
Spot SOL ETFs reported $58 million in net inflows yesterday, with about $39.5 million entering Bitwise’s BSOL. This inflow is the third-largest reported by Solana funds and the largest since November 3.
After Monday’s net inflows, spot SOL ETFs have accumulated total net assets of $843.81 million, or 1.09% of SOL’s market capitalization, since BSOL debuted on Oct. 28.
Solana Price Attempts A Rebound After Hitting Key Demand Zone
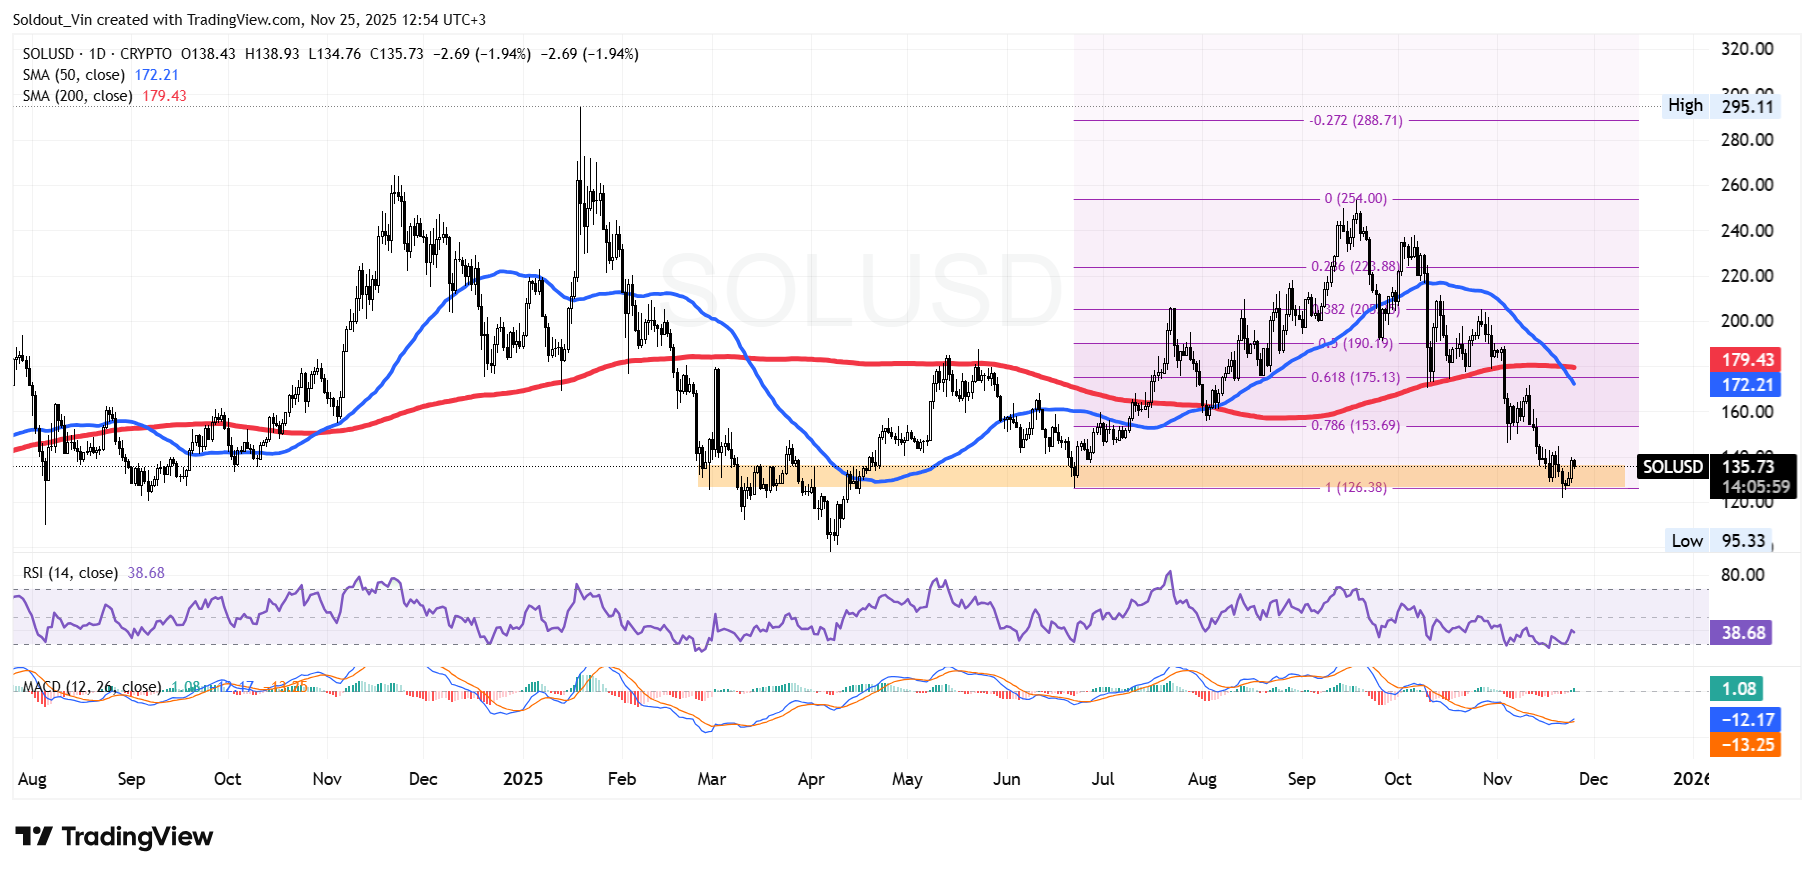
After trading below the $175 level for several weeks, the SOL price extended the bearish stance through October and November, pushing the token into a deeper corrective phase after the strong rally that took it to a local high at $254.
After reaching this high, the Solana price entered a prolonged correction, moving within a well-defined retracement structure as sellers regained control.
The sustained downward pressure drove the price of Solana below several major Fibonacci retracement levels, including the 0.618 at $175 and the 0.786 at $153, confirming a strong bearish shift in market sentiment.
The outlook weakened further when a death-cross structure formed around $180, with the 50-day Simple Moving Average (SMA) crossing below the 200-day SMA, confirming the bearish stance.
As a result, the price of SOL has continued to trade below both the 50-day and 200-day SMAs, reinforcing sellers’ dominance.
SOL price action then extended downward into the major demand zone around $126.38, a region that previously acted as an accumulation area earlier in the year.
However, after touching the lower boundary of this zone, SOL is now showing early signs of recovery, with the price attempting to consolidate and push back above the $140 region.
Meanwhile, the Relative Strength Index (RSI), which recently hovered near the 30–oversold threshold, has climbed toward the 39 range, signaling that bearish momentum is weakening, and buyers are stepping in.
Solana Price Prediction
According to the SOL/USD daily chart, the Solana price is trading near the lower boundary of a demand zone, which in most cases serves as initial support during extended corrections.
If buyers defend this level, a relief rally toward the midpoint of the recent decline could occur, setting an upside target near $175, on the 0.618 Fib level.
A stronger bullish continuation would require a breakout above the 50-day SMA near $172. Reclaiming this level could open the door for the bulls to push SOL toward the $190-$205 resistance area.
However, the recent death cross between the 50-day and 200-day SMAs suggests that bears still maintain longer-term control. If selling pressure resumes and SOL’s price falls below the $126–$135 support, a deeper retest of lower liquidity levels between $110 and $120 may follow.


