Solana Price Surges as CME Prepares to Launch Solana Futures Options

The Solana price has surged 5.9% in the last 24 hours, to trade at $246.68, on a 44% pump in the daily trading volume, to $12.75 billion.
The jump in Solana price comes as the CME Group announced it will launch options on Solana futures starting Oct. 13. This marks the first time CME is expanding its options beyond Bitcoin and Ether, signaling growing interest in altcoin derivatives.
The addition of Solana options also shows how traditional financial institutions are warming up to the broader crypto market, offering investors new ways to hedge and speculate. With daily, monthly, and quarterly expiries available, these products are expected to boost market liquidity and attract both institutional players and active retail traders.
The development comes at a time when regulated crypto derivatives are gaining traction in the U.S., supported by clearer rules and rising participation from major exchanges.
Solana Futures Open Interest Hits Record High as Price Climbs
Solana (SOL) futures are seeing record activity as both price and open interest climb. Data from Coinglass shows open interest has crossed $18 billion, while SOL’s price has jumped above $250. This marks one of Solana’s strongest rallies this year.
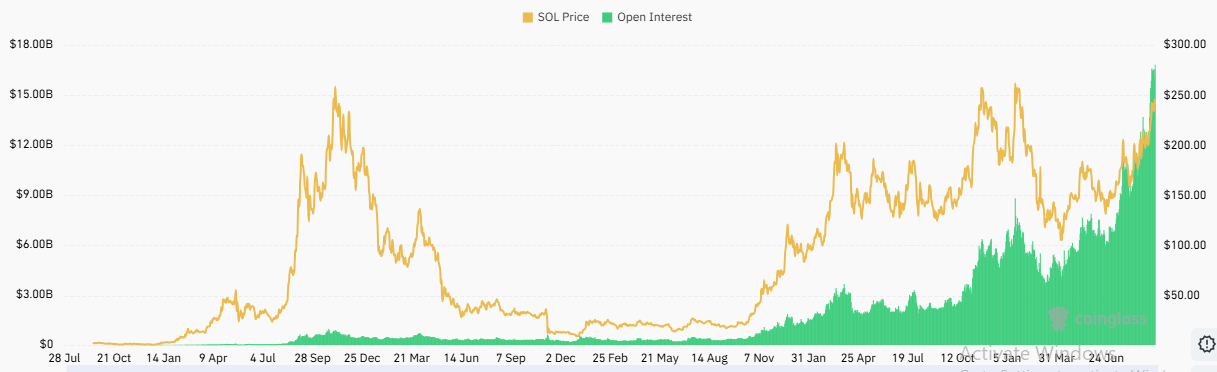
Exchange SOL Futures Open Interest. Source: Tradingview
The rise in futures activity shows that traders are betting big on Solana, with many expecting more price swings ahead. Open interest usually signals strong market participation but can also mean a higher risk of sudden corrections.
The momentum comes as Solana’s ecosystem expands and the CME plans to launch options on Solana futures, a move that could bring in more institutional traders. While the outlook remains bullish, analysts warn that the fast growth could also lead to sharp pullbacks if the market turns.
Solana Price Analysis: SOL Targets $300 After Breaking Key Resistance
Solana (SOL) continues its bullish run, trading at $246 after gaining momentum from a strong breakout above the resistance neckline. The chart shows that SOL has completed a parabolic curve formation, which often signals the start of an accelerated uptrend.
With buyers reclaiming market control, liquidity has shifted upward, pointing to a potential test of the $300–$325 resistance zone. Earlier this year, SOL was trapped in a bearish channel before bottoming out near $120. A recovery phase followed, marked by a clear reversal structure and rising support levels.
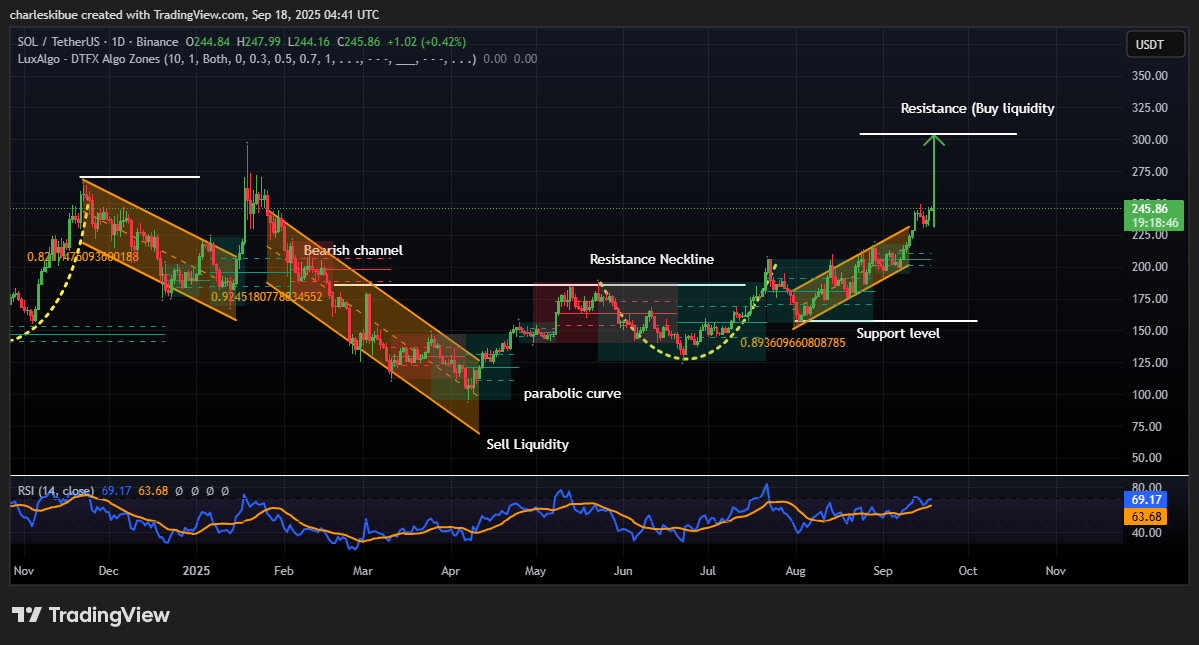
SOLUSDT Analysis Source: Tradingview
The breakout above $200 confirmed bullish strength, with the Relative Strength Index (RSI) now sitting near 69, just below the overbought zone. This suggests further upside remains possible, though traders should watch for short-term pullbacks.
If buying pressure continues, Solana could capture buy-side liquidity above $300, unlocking fresh highs. However, failure to sustain momentum could see SOL retest the $175–$200 support zone, where strong liquidity is clustered.
For now, the market structure remains bullish, with investors eyeing the $300 psychological barrier as the next key milestone.


