Solana Pulls Back 15%, Yet On-Chain Strength Signals a Return to $200
Solana fell 15% from recent highs, but strong on-chain activity, rising institutional demand, suggest a rebound toward $200.
Solana price has surged 1.26% in the last 24 hours, to trade at $180.80, on a 0.95% decrease in the daily trading volume, to $5.75 billion.
SOL On-Chain Strength Remains Solid
Solana (SOL) has seen a sharp pullback, dropping about 15%, as crypto markets are correct. Despite the price drop, Solana’s network fundamentals continue to impress. Recent data shows a steady increase in daily active users and healthy growth in decentralised apps (dApps) and NFT projects on the Solana blockchain.
The network keeps processing transactions at high speed and low fees, drawing in both developers and regular crypto users. On-chain metrics highlight another key point: even with the price pulling back, the number of holders is climbing, and large accounts are not rushing to sell.
Solana Futures Surge on Growing Institutional Demand
Open interest in SOL futures has jumped to $10.7 billion from $6.9 billion two months ago, now higher than XRP futures even though XRP’s market cap is 81% bigger. This shows rising institutional interest, a good sign for long-term growth.
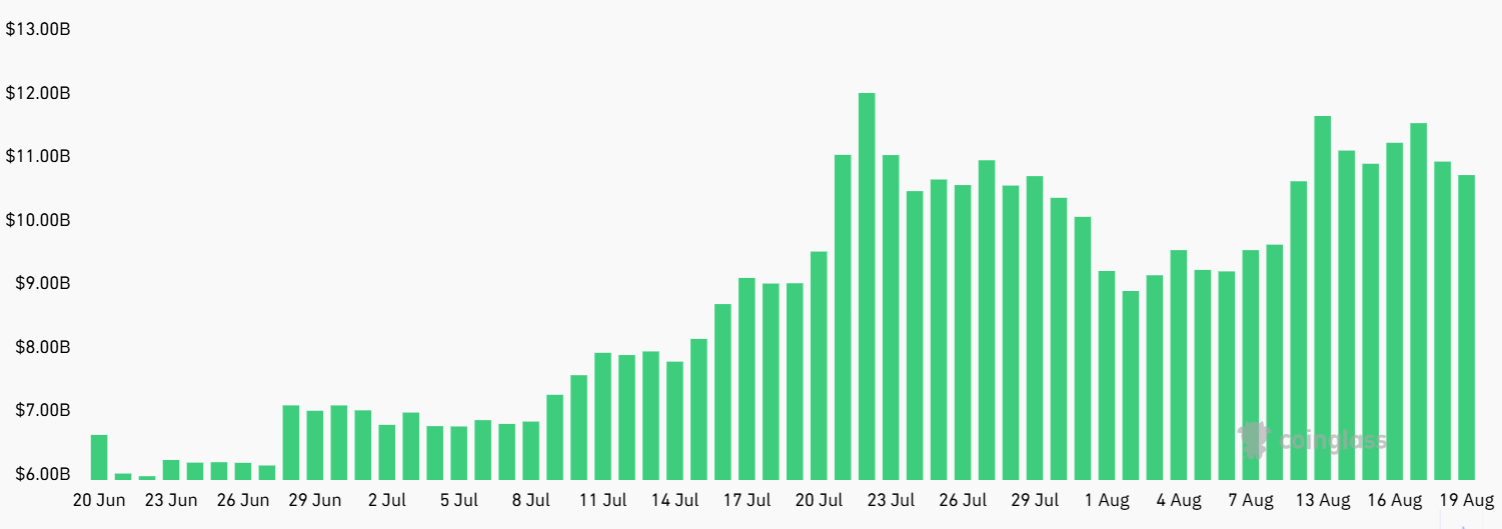
SOL futures aggregate open interest, USD. Source: CoinGlass
Institutional demand is also clear from $2.8 billion in Solana ETFs and ETPs. With a 7.3% staking yield, Solana could see strong inflows once spot ETFs launch in the U.S. Bloomberg analysts say there’s a 90% or higher chance of SEC approval by year-end.
The pullback from $209.80 worried some traders about a bearish double top. But Solana’s lead in DEX volumes, rising TVL, growing fees, and strong institutional backing suggest otherwise. These factors point to another push toward $200, meaning traders may have turned bearish too early.
Solana Price Support Holds Golden Cross In Place

SOLUSDT Analysis Source: Tradingview
Looking at the chart, SOL is climbing back from a dip. The price now sits around $180.63, up 2.5% on the day. The golden cross is clear and confirms bullish momentum. SOL has also reclaimed the support area near $174, bouncing off this key level after a brief slip.
Support 1, around $173.69, and support 2, near $157.24, are now crucial for bulls to defend. Each time SOL has dipped to these zones, buyers have stepped in and pushed prices higher. The chart’s uptrend remains intact, with higher lows and higher highs forming since early July.
Technical indicators match this bullish outlook. The RSI sits at 50.55, a neutral level, showing there’s plenty of room for the price to run higher. The MACD remains close to zero but could flip bullish soon if momentum builds. The ADX at 26.26 means the trend is moderate, not exhausted.
If SOL can break above $200 in the coming sessions, the next target sits much higher, potentially $260 or beyond, as shown by the blue high on the chart. If the $174–$157 support zone fails, the uptrend could pause for a deeper pullback, but for now, buyers have every reason to stay confident.