XRP Price Prediction As Peter Brandt Says XRP Could Do Well In Coming Months, ETFs See $21.8M Inflows
The XRP price edged up over 1% in the past 24 hours to trade at $2.20 as of 4:24 a.m. EST on trading volume that dropped 3% to $3.9 billion.
That comes as legendary commodity trader Peter Brandt predicted that XRP could do “quite well” in the months to come.
Even though Brandt did not explicitly mention the Ripple-affiliated token, some sleuths were quick to identify the specific chart he was referring to.
Crypto market participants identified the chart as a monthly XRP chart.
Meanwhile, the demand for the Ripple token is surging, as XRP ETFs (exchange-traded funds) recorded net daily inflows of $21.81 million in the latest trading session, according to SoSoValue data.
Bitwise led the day’s inflows. Its Bitwise XRP ETF added $7.46 million in fresh capital.
XRP Price Poised For A Sustained Recovery
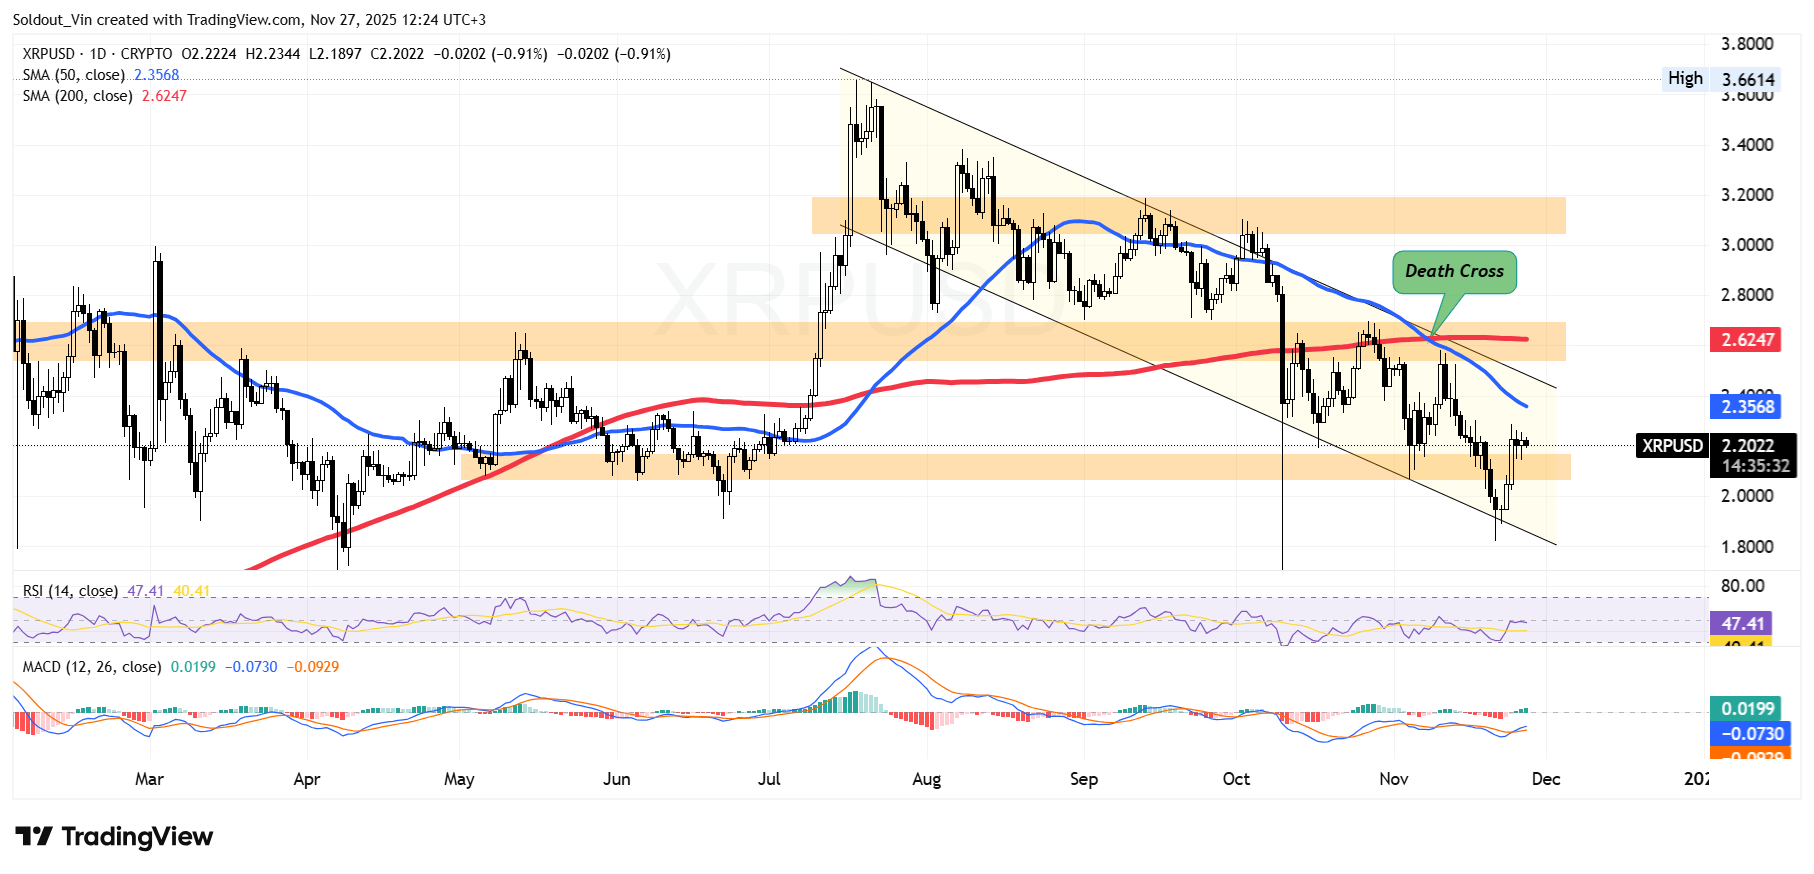
After trading under the $2.40–$2.50 region for several months earlier in the year, the XRP price eventually broke above this zone and accelerated into a strong upward move, pushing the token toward the $3.66 yearly high.
That breakout marked the beginning of a sharp parabolic push. Still, after reaching the high, the Ripple token price entered a corrective phase, losing bullish momentum as it traded within a falling channel.
Since then, bears have maintained tight control of the market. The bearish trend continued when a death cross formed near $2.62, where the 50-day Simple Moving Average (SMA) crossed below the 200-day SMA.
As a result, the token now trades below both SMAs, further fueling the bearish stance.
However, after hitting the lower boundary of the falling channel around $1.89, XRP is showing early signs of attempting a recovery. The price of XRP has bounced from this support area and is currently retesting the $2.20 zone, which is acting as immediate resistance.
Supporting the narrative, the Relative Strength Index (RSI) is also recovering from its earlier drop to the oversold region, currently at 47.
Meanwhile, the Moving Average Convergence Divergence (MACD) also supports the bullish stance, as the blue MACD line has finally crossed above the orange signal line.
Ripple Token Price Prediction
Given the existing market structure, XRP is moving towards the upper boundary of the falling channel.
If buyers continue to defend the current level, XRP could experience a relief bounce toward the channel’s midpoint. This places a near-term upside target between $2.30 and $2.40, a zone that also aligns with the 50-day SMA and will likely serve as the first major resistance.
A stronger bullish reversal would require XRP to break above the channel’s upper boundary.
However, the recent death cross between the 50-day and 200-day SMAs indicates that the overall trend still favors the bears.
If selling pressure persists and the Ripple token fails to hold its current support, the price could slide back toward lower liquidity zones in the $1.80 to $1.95 range.


