XRP Price Prediction: Can XRP Break $3 After 12% Surge on ETF Inflows?
The XRP price soared over 12% in the past 24 hours to trade at $2.36 as of 2:21 a.m. EST on trading volume that skyrocketed 146% to $8.1 billion.
The Ripple token has rallied over 29% in the last week, outperforming both BTC and ETH in recent days.
This surge comes as reports indicate that exchange reserves of XRP hit an 8-year low, down 57% from October 2025. This, combined with aggressive inflows into exchange-traded funds (ETFs), has set up the current explosive rally.
On January 5, XRP ETF flows saw a $46.1 million daily net inflow, according to SoSoValue data.
“XRP ETFs saw strong inflows as investors positioned for renewed payment adoption narratives,” Liu said. “XRP’s liquidity makes it a clean vehicle for expressing directional risk,” Kronos Research CIO Vincent Liu said.
XRP Price Breaks Out – Momentum Shifts Back to Bull
The XRP price is showing renewed strength after breaking out of a prolonged falling wedge, suggesting the corrective phase following its previous peak may be coming to an end.
After declining from a high of $3.66, the Ripple token traded lower for several months in a controlled downtrend before stabilizing and regaining bullish momentum.
The pullback deepened as the price of XRP slipped below the 50-day Simple Moving Average (SMA) on the 3-day timeframe, which shows short-term weakness during the correction.
Despite this, the price of the Ripple token remained above the 200-day SMA, which continued to act as a key long-term support zone around the $1.85–$1.90 region. This area coincided with a deep Fibonacci retracement, during which buying interest increased, halting further downside pressure.
The strong demand at this level allowed XRP to form a base and break above the falling wedge resistance at around $2.
This structural breakout marked an important shift in market behavior, with price now attempting to reclaim the 50-day SMA near the mid-$2.40 range. Holding above this area would reinforce the view that the broader uptrend remains intact.
The Relative Strength Index (RSI) has moved back above the neutral midpoint and is currently hovering in the upper-50s, indicating strengthening buying pressure without signs of exhaustion.
The Stochastic RSI shows a recovery from lower levels, supporting the idea that upside momentum is rebuilding.
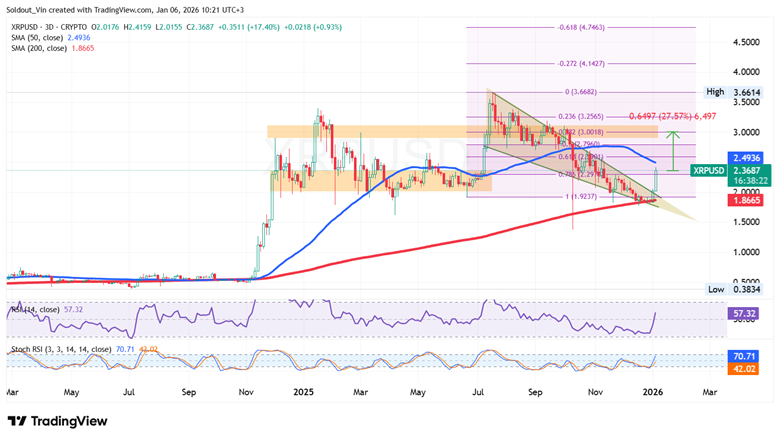
XRP/USD Chart Analysis: TradingView
Can Ripple Token Smash $3?
From a technical analysis perspective, the XRP/USD chart suggests that the Ripple token may continue its recovery as long as the price holds above the recent breakout zone around $2.
A sustained surge could see XRP gradually challenge higher Fibonacci retracement levels in the upper-$2 range, with further upside possible if momentum remains supported by volume and trend strength.
In such a case, the bulls could push XRP to a 27.57% rally, targeting the $3 level on the 0.382 Fib zone.
On the downside, a loss of support around the recent demand area would weaken the bullish outlook and expose the price of XRP to a deeper pullback toward $1.90.


