


XRP Price Regains $2 Flipping BNB In Market Cap – Is $2.5 In Sight?
The XRP price soared over 8% in the past 24 hours to trade at $2.02 as of 1:41 a.m. EST on trading volume that skyrocketed 231% to $4.36 billion.
XRP has jumped above the $2.00 price level and temporarily flipped BNB to become the third-largest cryptocurrency by market capitalization.
The Ripple token recovered as the crypto market surged, boosting XRP’s market capitalization to about $123 million, according to data from CoinMarketCap, with BNB just behind at $120 million market value.
Without counting stablecoins, XRP now sits behind only BTC and ETH. As the market surged over 2.2% to a $3.07 trillion market capitalization, BTC climbed to trade above the $90,000 level, as the Ethereum token continued to trade above the $3,000 zone.
The rally could be attributed to the strong spot XRP exchange-traded funds (ETFs) inflows, extending the inflow streaks.
XRP Price Breaks Out Of Falling Wedge, Eyes Recovery
The XRP price has broken above the upper trendline of a falling wedge pattern. It is now consolidating above the $2.00 level, signalling a potential trend reversal after an extended corrective phase.
XRP entered a sustained bearish correction after peaking near the $3.60 region, where strong rejection occurred at key Fibonacci resistance levels. This drop eventually formed a falling wedge, characterized by lower highs and lower lows with contracting price action, a structure commonly associated with bullish reversals.
The bearish momentum was reinforced as XRP traded below both the 50-day and 200-day Simple Moving Averages (SMAs), keeping the broader trend under pressure. However, the recent wedge breakout marks a meaningful shift in market structure.
Following the breakout, XRP has reclaimed the 50-day SMA around $2.02, which now acts as short-term dynamic support. The Ripple token price is currently consolidating just above this level.
Momentum indicators support the breakout. The Relative Strength Index (RSI) is holding above the 50-midline near 57, indicating strengthening buying pressure.
Moreover, the Moving Average Convergence Divergence (MACD) continues to improve, with a positive histogram and upward momentum, confirming that bearish pressure has faded following the wedge breakout.
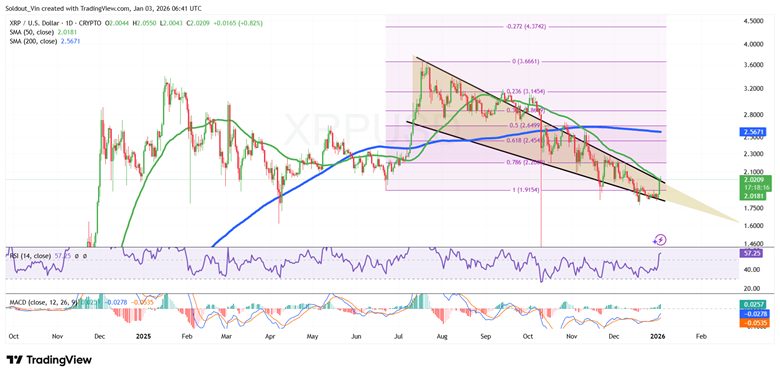
XRP/USD Chart Analysis: TradingView
Ripple Token Price Prediction
Based on the XRP/USD daily chart, XRP price action suggests a bullish breakout with a cautious continuation phase, as the market digests gains after exiting the falling wedge.
XRP is trading above the 50-day SMA and above former wedge resistance, which now acts as structural support. As long as price holds above the $2.00–$2.05 zone, the breakout remains technically valid.
In the short term, sustained consolidation above this level could allow XRP to build momentum for a move toward $2.45–$2.55, where the 200-day SMA and the 0.618 Fibonacci retracement converge.
A decisive break above this resistance zone would strengthen the bullish case, opening the door for further upside toward $2.80 and $3.00, aligning with the 0.5 and 0.382 Fibonacci retracement levels.
On the downside, failure to hold above the former wedge resistance and the $2.00 psychological level would put the breakout at risk. A breakdown below this area could lead to a pullback toward $1.90 and a risk to drop to the $1.70 level.
About Author

About Author




