XRP Price Rises 1.76% Ahead of 21Shares U.S. Spot XRP ETF Launch, CoinShares withdraws its XRP ETF filing

The XRP price has surged 1.76% in the past 24 hours to trade at $2.20 on trading volume that dropped 3% to $3.9 billion.
The increase in XRP price comes as 21Shares gears up to launch its U.S. spot XRP ETF on Monday under the ticker TOXR, listed on the Cboe BZX Exchange after SEC approval via a Form 8-A filing. The ETF will track the CME CF XRP-Dollar Reference Rate, giving investors exposure to XRP’s spot price without holding the token directly.
This launch marks the fifth XRP ETF to enter the U.S. market in recent days, joining products from Grayscale and Franklin Templeton. GXRP and XRPZ recorded first-day inflows of $67.36 million and $62.59 million, respectively.
Institutional demand is driving momentum, with $666 million in net inflows into XRP ETFs in less than a month, pushing total net assets to $687.81 million—about 0.52% of XRP’s market cap. No outflows were recorded, and inflows peaked during Canary’s debut on November 14, continuing with $22.68 million entering the funds recently. This accumulation has reduced XRP’s liquid supply as tokens are stored in regulated vaults.
Meanwhile, CoinShares withdrew its expected XRP ETF filing, likely due to company restructuring after multiple amendments in August and October. 21Shares’ listing highlights growing institutional appetite for regulated crypto products in the U.S.
XRP Price Consolidates After a Steep Decline
XRP has recently shown signs of stabilization around $2.185 after experiencing a sharp decline from its July high near $3.66. The price remains below both the 50-day simple moving average (SMA) at $2.34 and the 200-day SMA at $2.62, indicating that the medium-term trend is still bearish.
The fact that the 50-day SMA is positioned below the 200-day SMA further confirms continued downward pressure, signaling that any upward moves may face resistance before establishing a sustained recovery.
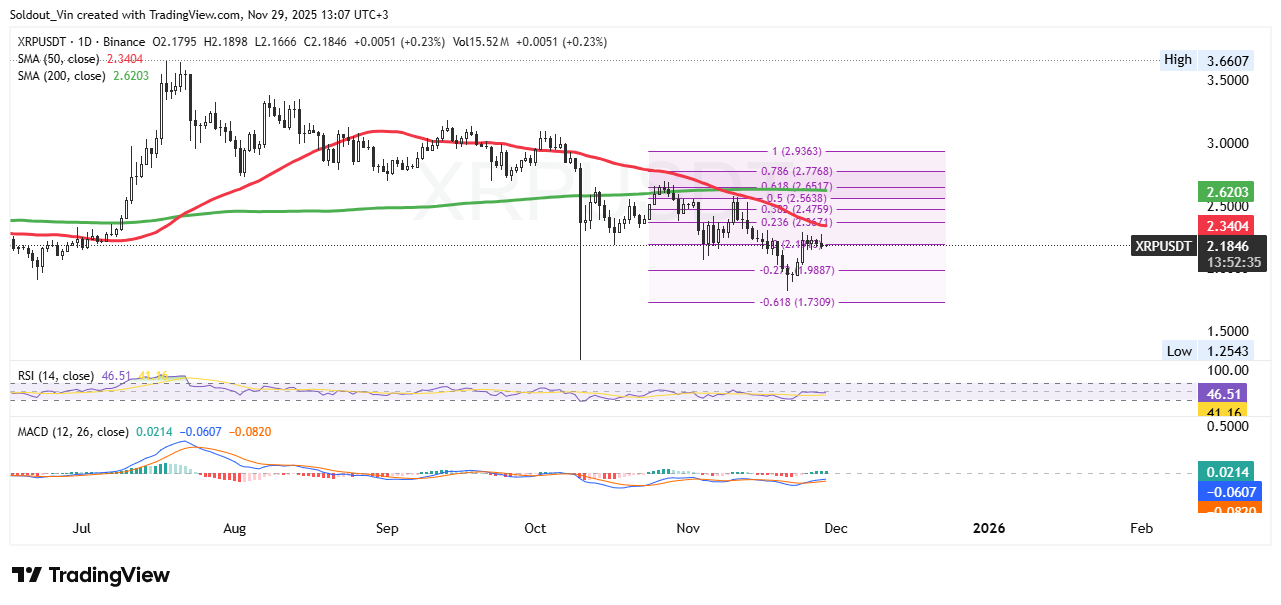
Traders should closely watch key resistance levels at $2.25, $2.48, and $2.56, which also coincide with moving averages, creating potential supply zones that could limit upward momentum. On the downside, support at $1.9887 has held recently, while a breakdown below this level may open the door for further declines toward $1.73, representing the next significant support area.
The Relative Strength Index (RSI) at 46.5 has recovered slightly from oversold levels, indicating that selling pressure is easing, although momentum remains neutral. A sustained move above 50 on the RSI would provide early confirmation of short-term bullish momentum.
Similarly, the MACD is beginning to show a potential bullish crossover, with the MACD line approaching the signal line from below and the histogram trending toward positive territory, hinting that a short-term corrective rally could be underway.


