200-Week SMA Caps Bitcoin’s Rally as Weak Jobs Data Lifts Risk Assets
Bitcoin touched $62,295 on July 5 as weak US payrolls data boosted rate-cut hopes, but the 200-week SMA at $62,652 remains unbroken resistance.
Bitcoin reached $62,295 on Bitstamp on Friday, July 5 – its highest print since June 24 – as the Dow Jones closed at record highs ahead of the US Independence Day holiday and the global stock market cap simultaneously set a new all-time high, with the macro catalyst a weaker-than-expected US nonfarm payrolls report that mechanically compressed Federal Reserve rate-hike odds and redirected institutional flows toward risk assets.
Weak Payrolls Data Pulls the Rate Lever
The June nonfarm payrolls print came in below consensus, and the market’s response was immediate and directionally consistent with the prevailing rate-sensitivity regime. Mosaic Asset Company framed the mechanism precisely, writing that “the knee-jerk reaction from investors was to push stock index futures higher, signaling a regime where bad economic news is good for stocks due to the impact on the rate outlook.”
Mosaic further characterized the figure as a “Goldilocks” reading – “not too cold to stoke growth fears and not too hot to pull additional rate hikes forward” – which placed both equities and crypto in a favorable positioning window. The latest data from CME Group’s FedWatch Tool showed roughly equal odds of a pause or hike at the Fed’s September meeting, with current target rates expected to hold until then. That ambiguity is itself a tailwind: prior analysis tracking how jobs data shapes Bitcoin’s rate-cut narrative shows that flat-to-dovish Fed signals have consistently unlocked short-term upside in BTC.
The equity channel amplified the move. The Kobeissi Letter noted on X that “global equities are in the midst of one of the most powerful rallies in history,” with the global stock market cap printing a new all-time high on the same session Bitcoin tagged its nine-day peak. The co-move is not incidental – institutional desks are increasingly treating BTC as a high-beta risk asset when rate-path probabilities shift dovish, rotating exposure alongside equities rather than as a standalone macro hedge.

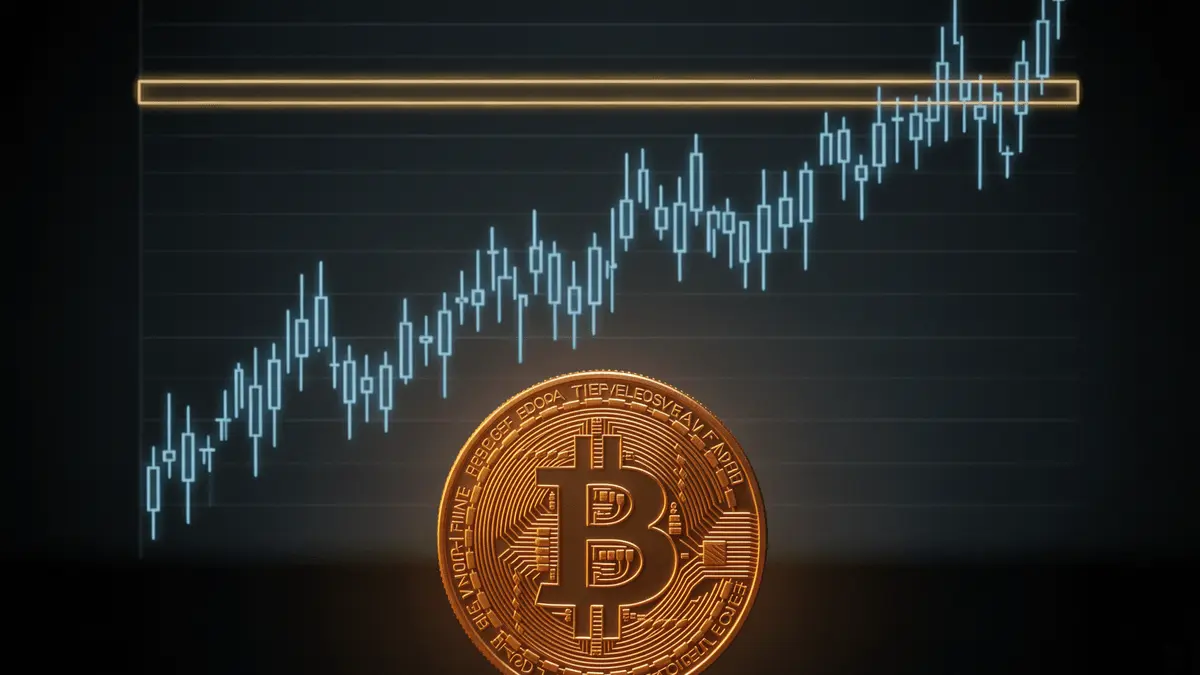
Technical Structure: The 200-Week SMA as the Governing Level
The $62,295 high places Bitcoin directly beneath a technically significant cluster. The 200-week simple moving average currently sits at $62,652, and the $62,000–$62,500 band has been identified by multiple analysts as a strong resistance zone – meaning Friday’s high arrived at the ceiling rather than clearing it.
Trader Daan Crypto Trades focused specifically on the 200-week SMA as the key level for the weekly candle close, noting: “It is key for BTC now to hold this breakout and maintain its low timeframe bullish market structure,” and characterizing the current trading zone as “important.” The structural read is clear: a weekly close above $62,652 would mark the first sustained hold above the 200-week SMA since the broader correction began, shifting the medium-term bias mechanically rather than on sentiment alone.

X commentator Exitpump observed “controlled slow buying” on exchanges, writing that price action “looks good for continuation higher, although keeping in mind 62K–62.5K as a strong resistance area.” The characterization of buying as controlled rather than aggressive matters: it suggests the move is not yet driven by a momentum-chasing spike that would be vulnerable to a sharp reversal, but it also means conviction has not yet produced a clean breakout.
BTC Downside Risk: What a Rejection at the SMA Sets Up
Bitcoin has repeatedly failed to sustain breakouts above the low-$60K band over the preceding weeks, with prior rallies fading as rate-cut odds shifted and macro uncertainty reasserted. A weekly close back below $62,000 – particularly if accompanied by a deterioration in Fed dovishness from incoming inflation data – would confirm the 200-week SMA as overhead resistance rather than reclaimed support, reopening a retest of the mid-to-upper $50K range that has served as the structural floor across this cycle’s correction. That pattern played out in an earlier episode documented when macro data drove BTC toward a floor near $57,779 before stabilizing.
Bitcoin’s correlation with equities also introduces a specific asymmetric risk here: the same macro regime that is currently supportive – bad economic data read as dovish – can reverse sharply if incoming prints shift toward stagflation rather than soft-landing readings, a scenario where equities and crypto would face simultaneous selling pressure. Geopolitical catalysts have also proven capable of disrupting this correlation in either direction, as seen when a geopolitical macro catalyst drove a specific BTC rally through risk-sentiment channels largely independent of Fed positioning.
Bullish Case: Weekly Close Above the 200-Week SMA
The bullish scenario requires a weekly close above $62,652 – the 200-week SMA – which would technically confirm the level as reclaimed support rather than an ongoing ceiling. From there, the next structural resistance sits in the mid-to-upper $63K range, with a clean break of that band opening the path toward the prior consolidation zone near $65,000–$67,000 that defined the market structure before the June drawdown.
The underlying network fundamentals are not a headwind to this scenario. Bitcoin’s hash rate has set repeated record or near-record averages this year, signaling sustained miner confidence even through price drawdowns – a structural backstop that limits the probability of a disorderly breakdown. Whether the macro regime holds long enough to give that technical confirmation is the governing question the market will be forced to price in the sessions ahead.

Follow CoinNews on X and Telegram for real-time market updates as Bitcoin tests this critical technical zone.