


CPI Print in 72 Hours Will Decide If Bitcoin’s $64K Rebound Is Real
Bitcoin trades near $64,100 with thin volume and one day of ETF inflows as June CPI data due July 14 threatens to make or break the rebound.

Bitcoin traded near $64,100 on July 11, up roughly 2.6% over seven days according to CryptoSlate market data, but the rebound carries a structural qualifier that limits its credibility: 24-hour volume was running 21% below its recent average, buyers have committed to only one session of positive ETF flows, and June’s US consumer price index drops at 8:30 a.m. ET on July 14 – leaving approximately three days before the next macro catalyst either validates or dismantles the move.
The macro configuration around that print is already leaning toward caution. The two-year Treasury yield ended July 10 at 4.21% and the ten-year at 4.56%, both higher on the day. Futures-derived probabilities put a 64.6% chance on the Federal Reserve holding its 3.50%–3.75% target range on July 29 and a 35.4% chance on a quarter-point hike, per CME FedWatch methodology. By September, markets are pricing a 50.9% chance of rates reaching 3.75%–4.00% and an 18.8% chance of 4.00%–4.25%.
ETF Flows: One Day of Inflows Against Two Days of Outflows
US spot Bitcoin funds recorded a net $90.4 million in inflows on July 10 after losing a combined $180.2 million over the prior two sessions, according to fund flow data cited by CryptoSlate. That single positive session does not establish a trend – it establishes a question. Prior analysis of Bitcoin’s bounce to similar price levels showed that ETF demand and short-squeeze dynamics can briefly align without confirming durable buyer commitment, and the current data is consistent with that pattern.
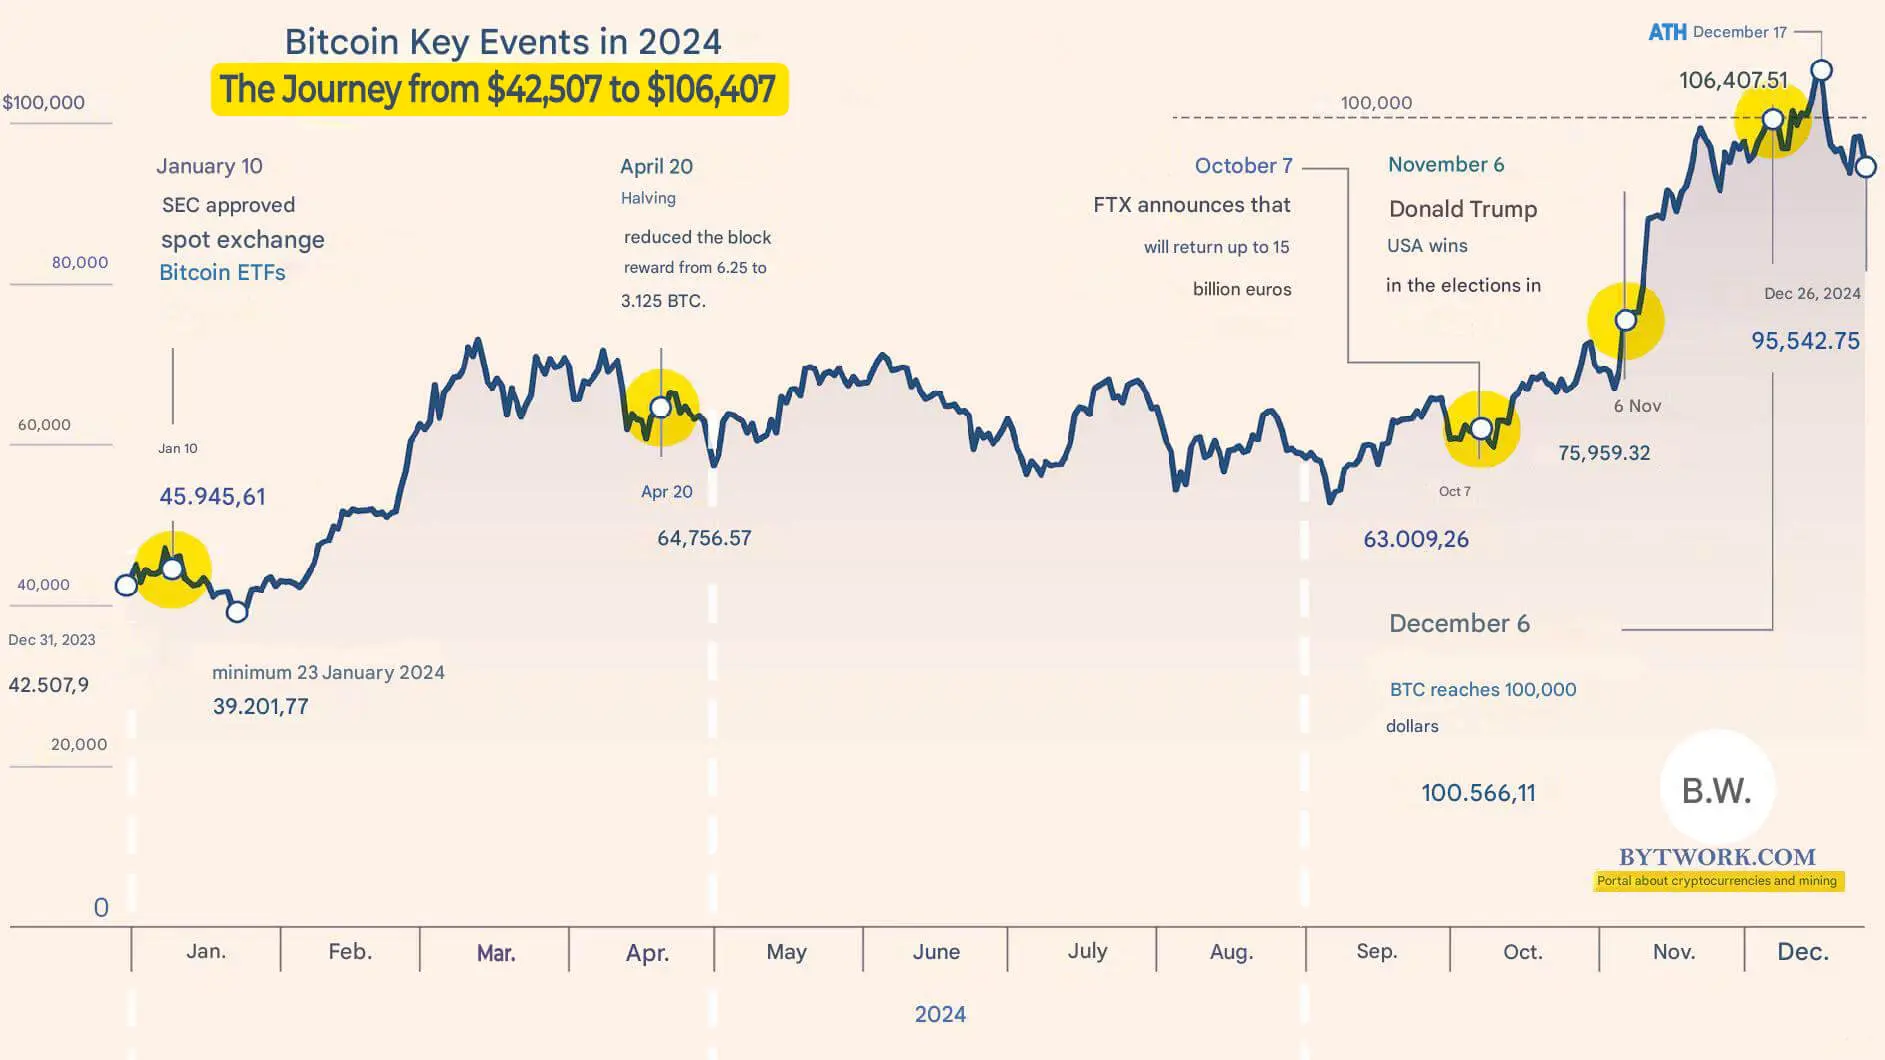
Bitcoin futures open interest stood near $47.3 billion, with modest positive funding and short liquidations dominating the previous 24 hours. That combination – active positioning alongside only modest long exposure – points to a market that is covering rather than aggressively accumulating. The on-chain momentum context around similar setups has historically flagged this configuration as consistent with a relief rally rather than a trend change.
Three CPI Paths and What Each Means for $64,000
An upside inflation surprise is the most direct threat to the current price. A hotter-than-expected print would likely lift yields and push the dollar higher from around the 101 area, raise rate-hike probabilities further, and put fresh Bitcoin longs at risk if ETF buyers retreat in response. The $64,000 level would face immediate pressure, and a rejection from current levels opens a path back toward the swing lows that preceded this rebound.
An inline result leaves the rebound dependent on flows. With leverage orderly and ETF demand positive for only one session, holding $64,000 after the macro event passes would require buyers to keep absorbing supply without a clear macro tailwind – a scenario that demands sustained institutional participation rather than a single session’s worth of inflows. The broader resistance structure between $64,000 and $66,000 has historically acted as a decisive reversal zone, and prior technical analysis of Bitcoin testing this 200-week SMA resistance band illustrates how often price has stalled at precisely this range during recovery attempts.
A downside surprise – softer-than-expected inflation – gives later easing expectations room to recover. Falling yields and a weaker dollar could extend ETF demand and reinforce the rebound, though the CryptoSlate analysis frames this as the lower-confidence branch ahead of the report. Current rate-path probabilities do not yet favor this outcome as the base case.
A split between headline and core inflation could produce the sharpest two-way trade. The first durable signal will be whether Fed probabilities, Treasury yields, and the dollar move together after the print. The second will be whether the next ETF flow data confirms the directional move or exposes $64,000 as another short-covering pause rather than genuine accumulation.
Market Structure: What Holds and What Breaks the Rebound
Bitcoin’s broader market context adds weight to the skeptical read. Bitcoin dominance sits at 58.49% against a total crypto market cap of $2.19 trillion, with $47.49 billion in 24-hour market volume. Bitcoin’s market cap stands at $1.29 trillion, and the asset remains 48.98% below its all-time high of $126,198 set on October 6, 2025 – a structural gap that frames any move at $64,000 as deep recovery territory rather than price discovery.
The path of least resistance for the next 72 hours runs directly through the CPI print. If inflation data comes in hot, the mechanical sequence – yields up, dollar up, rate-hike odds up, ETF buyers retreat – is well established, and $64,000 will face a test it is not currently positioned to pass on volume alone. If the print is benign or soft, the rebound has a macro argument behind it for the first time since the recovery began. The market will be forced to price one of those two outcomes by the close of July 14, and the current data stack offers no strong prior on which one arrives.
Follow CoinNews on X and Telegram for real-time Bitcoin market updates and CPI reaction coverage.
Source: CryptoSlate
About Author

About Author




