Bitcoin Price Prediction As BTC Retakes $112K Ahead Of Pivotal US CPI Data, Fed Rates Decision

The Bitcoin price dropped a fraction of a percentage in the past 24 hours to trade at $112,318 as of 6:05 a.m. EST on trading volume that surge 11% to $45.1 billion.
BTC is moving in a tight range near $111k-$112k, reflecting a market bracing for US CPI data tomorrow and the Fed’s rate decision next week.
For the crypto market, the outcome is crucial: a softer CPI reading would cement the dovish Fed outlook, while any upside surprises would prompt caution.
Polymarket bettors assign an 82% chance of a 25-basis-point cut on September 17.
Institutions Remain Bullish On Bitcoin
As the crypto space awaits key economic data and Fed policy developments, institutions remain bullish on Bitcoin.
Metaplanet plans to raise $1.4 billion through its international share sale, which will be used towards buying BTC, the firm’s CEO, Simon Gerovich, said on Sept. 9.
Meanwhile, data from Coinglass shows that spot BTC exchange-traded funds (ETFs) have recorded two consecutive days of inflows.
Furthermore, data from CryptoQuant shows that demand for BTC accumulator addresses reached an all-time high with over 266,000 BTC accumulated.
This shows strong long-term holder behavior amid corporate adoption.
Bitcoin Price Analysis: Signs of Strength Emerging After Recent Pullback
The BTC price chart analysis on the daily timeframe indicates an important recovery phase is developing after a sharp rejection from the $124,500 level, which had acted as strong resistance in mid-summer.
Following this rejection, the Bitcoin price retraced towards the $102,000–$105,000 support zone, where it found buyers near both the 200-day Simple Moving Average (SMA) and the 0.382 Fibonacci retracement level.
The price is currently trading around $112,300, sitting below the 50-day SMA ($114,652) but well above the 200-day SMA ($101,980). The structure indicates that BTC is in a sideways-to-slightly bullish consolidation, where the asset is holding higher lows while facing pressure from the mid-term moving average.
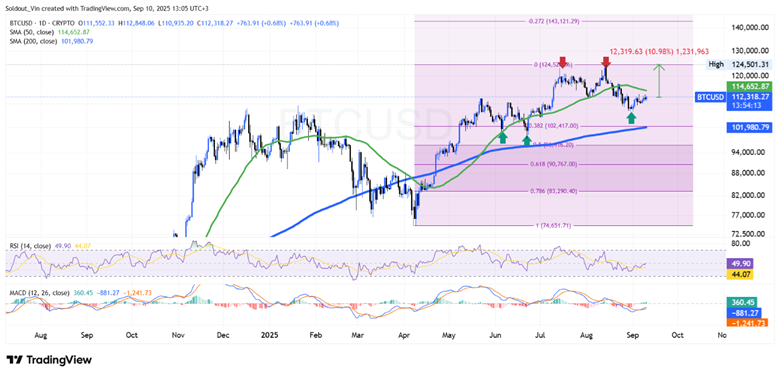
BTC/USD Chart Analysis: TradingView
BTC Price Indicators: Will Bulls Regain Control?
The Relative Strength Index (RSI) is currently hovering at 49.90, right near the neutral 50 level, showing that momentum is neither strongly bullish nor bearish.
However, the RSI seems to be stabilizing after an earlier decline, which may be a sign that buyers are regaining control.
Though the Moving Average Convergence Divergence (MACD) remains below the neutral line, the blue MACD line has crossed below the orange signal line, which may be an indication of a bullish crossover and early signs that the bulls may gain control in the coming days.
If the price of Bitcoin maintains its support above $110,000 and breaks back above the 50-day SMA, the next upside target is the recent high at $124,500, a 10% from the current level. A successful breakout above this resistance could trigger a rally toward the Fibonacci extension level at $143,000.
In the short term, crypto analyst Ali Martinez believes that a break past the $113,000 level could push the BTC price towards $116,000.
On the downside, if BTC loses the $102,000–$105,000 support range, it risks sliding toward the 0.5 Fibonacci retracement near $96,000.


