Bitcoin Slips Below $108K Amid ‘Death Cross’ Signal As Saylor Eyes Another BTC Buy

The Bitcoin price slumped 3% in the past 24 hours to trade at $107,354 as of 5:25 a.m. EST on trading volume that surged 57% to $47.3 billion.
Bitcoin dropped below the $108,000 level as Strategy’s Michael Saylor hinted at another BTC buy.
“Orange is the color of November,” he said on X, a phrase widely interpreted by traders as a nod to BTC’s signature orange color and an indication of another imminent buy.
Strategy currently holds 640,808 BTC, worth approximately $68 billion, making it the largest corporate holder of the king of cryptos.
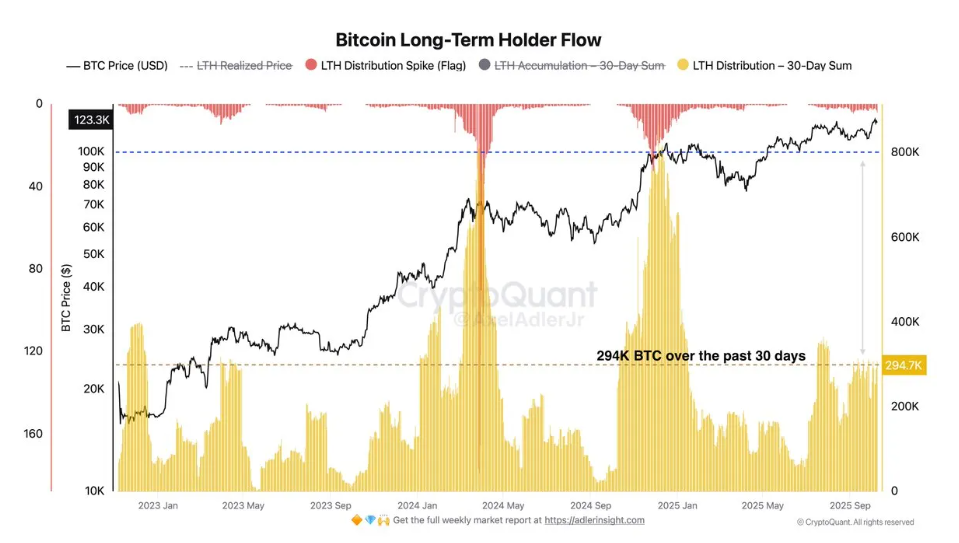
This comes as data from CryptoQuant shows that Bitcoin HODLers have sold a total of 405,000 BTC over the past month, suggesting a significant shift in their trading behavior.
Bitcoin Price Struggles To Hold Key Support As Death Cross Confirms Bearish Momentum
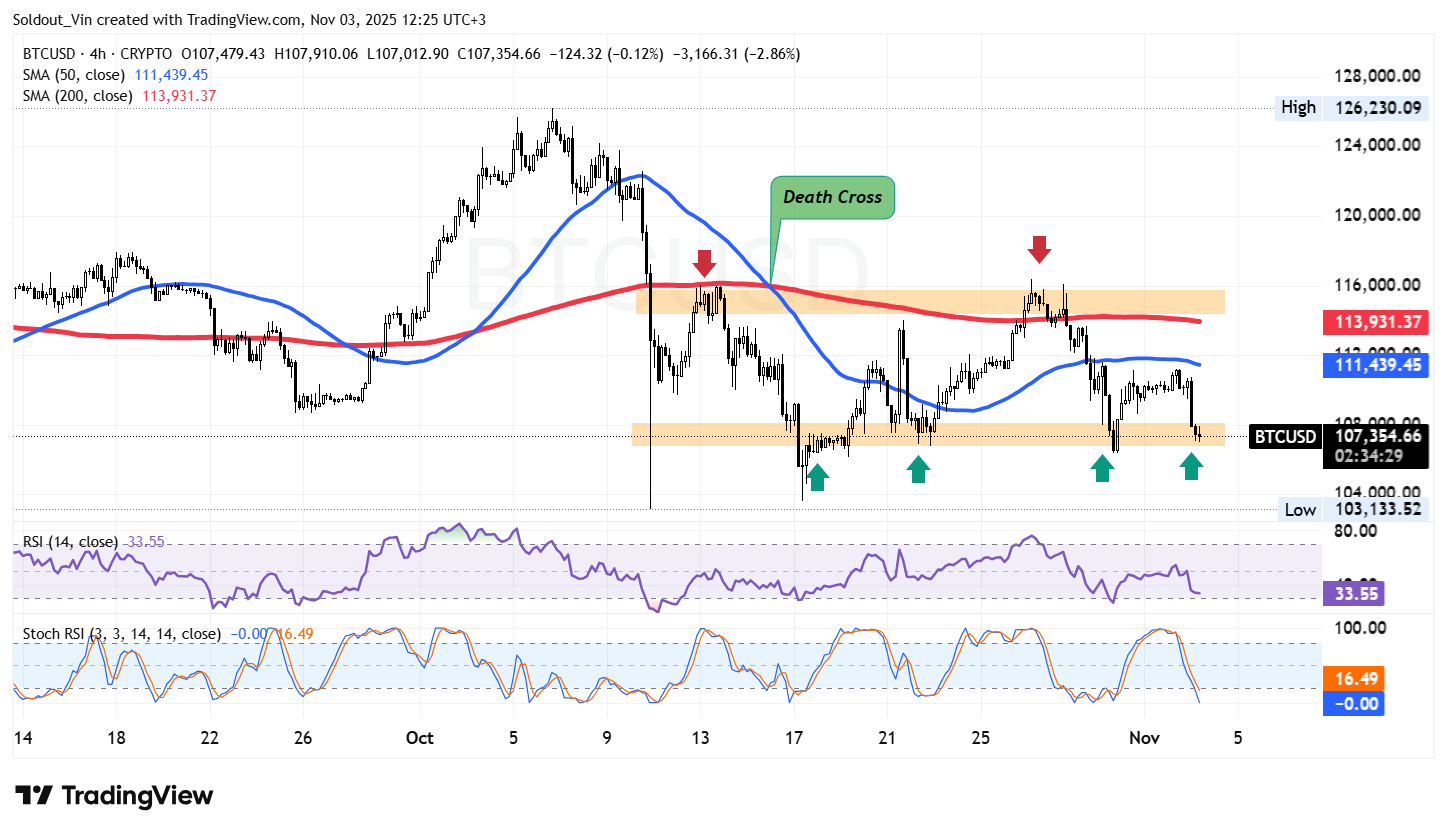
The BTC price has been under bearish pressure in recent weeks, slipping below its key moving averages and confirming a death cross on the 4-hour chart, which is a classic bearish signal that occurs when the 50-day Simple Moving Average (SMA) crosses below the 200-day SMA.
After reaching a recent high near $126,230, the Bitcoin price faced multiple rejections around the $113,000–$116,000 resistance zone, where both SMAs have converged.
After failing to reclaim this level, BTC has sustained downside momentum, bringing it back toward the critical $104,000–$107,000 support area.
Currently trading near $107,354, Bitcoin is retesting this support for the fourth time, as highlighted by repeated rebounds (green arrows) from this zone. The price reaction here will be pivotal in determining the next directional move.
BTC remains in a short-term bearish structure, with the 50-day SMA (blue) trending below the 200-day SMA (red), both serving as dynamic overhead resistance.
The Relative Strength Index (RSI) is trading around 33.5, signaling intense selling pressure but also hinting that downside momentum could be fading.
Similarly, the Stochastic RSI is deeply oversold, hovering near zero.
Despite these potential signs of relief, the broader outlook remains cautious unless BTC can reclaim and sustain levels above $111,000–$114,000.
BTC Price Prediction: Bearish Bias Persists Below $111,000
According to the 4-hour BTC/USD chart, the Bitcoin price is forming a potential double bottom near the $107,000 support level.
If buying pressure strengthens at this zone, BTC could attempt a short-term rebound toward $111,000 (50-day SMA) and $113,500 (200-day SMA).
However, failure to hold above the $104,000–$107,000 support region could trigger further downside, exposing the BTC price to the next demand zone near $100,000–$103,000.


