Bitcoin Slides Toward Key Support as Macro Pressure, ETF Outflows and Fear Grip the Market
Rising yields, ETF outflows and extreme fear pressure in the market is raising concerns about a deeper bearish shift.
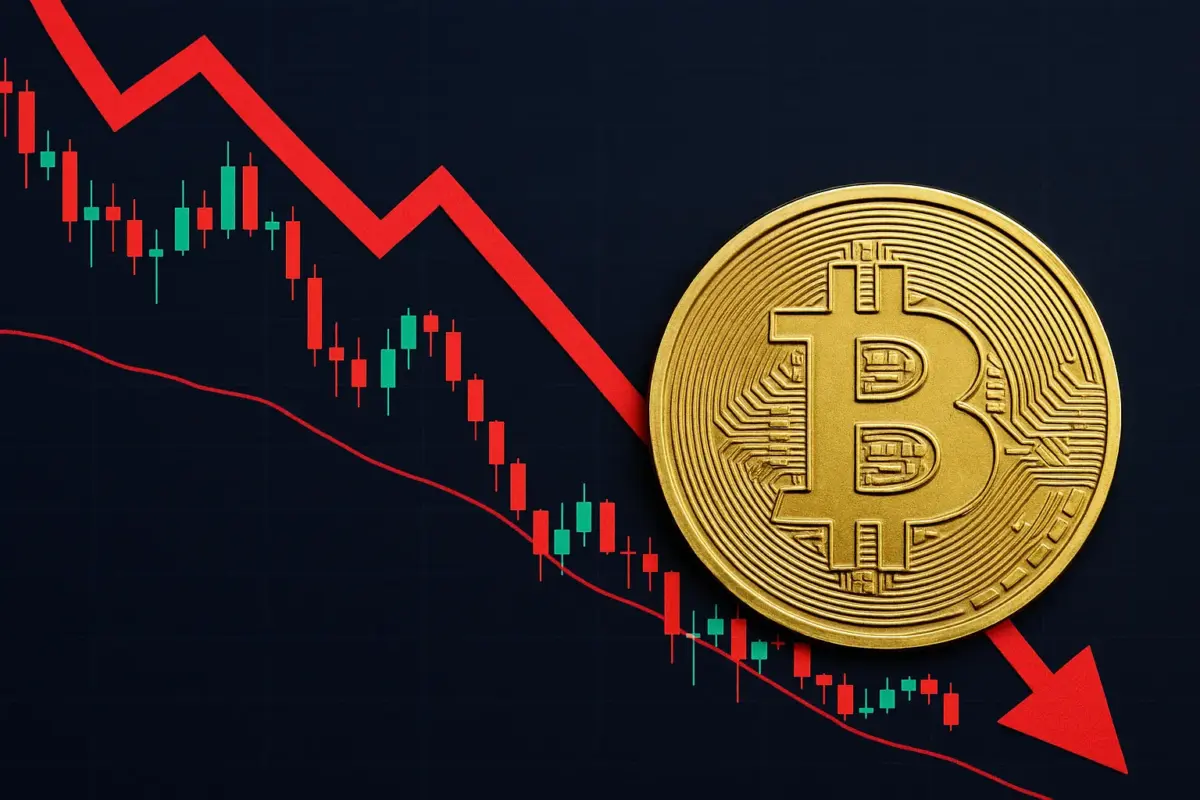
Bitcoin’s ($BTC) recent downturn has escalated into one of its steepest multi-week slides of the year, with the world’s largest cryptocurrency dropping 5.49% in the past 24 hours and briefly touching $95,383 before attempting to stabilize above the $96,000 mark.
The retreat comes during a stretch of broad risk-off sentiment, fueled by shifting expectations around Federal Reserve policy and heightened volatility across traditional markets.
The pullback has pushed the Bitcoin Fear and Greed Index into levels not seen since early spring. The index registered a reading of 15 on November 13 before nudging slightly higher to 16 the next day, well within the “Extreme Fear” zone.
That stands in stark contrast to last month, when sentiment hovered near 34, a level considered standard “Fear,” and above last week’s 24 reading. The last time traders witnessed this degree of pessimism was February 27, 2025, when sentiment slumped to 10 after a steep, multi-week decline.
The mood worsened after the Federal Reserve dismissed the possibility of a December rate cut, a decision that rattled risk assets worldwide. As Treasury yields climbed and liquidity tightened, both equities and crypto assets faced synchronized outflows.
Bitcoin’s slump tracked closely with stock market weakness: the Nasdaq fell around 2% on Thursday, highlighting how sensitive digital assets remain to macroeconomic catalysts. During the session, Bitcoin traded almost in tandem with major U.S. indices, underscoring how quickly sentiment shifted after the Fed signaled a more restrictive stance.
A tightening macro environment has added pressure to Bitcoin at a moment when the asset has already retreated sharply from its all-time high. The cryptocurrency fell below $95,000 on Friday morning, marking an 8% decline on the day and more than 24% off its peak of $126,200 reached just five weeks ago. The downturn has triggered widespread liquidations: more than $1.24 billion in crypto longs were wiped out in the last 24 hours, according to CoinGlass data.
The selloff isn’t limited to crypto. The S&P 500 was down nearly 1% in pre-market trading on Friday, while gold, typically a safe haven, slipped 2.76%, showing that the risk aversion is global and not confined to digital assets.
Bitcoin is on track to post its third consecutive weekly red candle, and the slide has taken a significant toll on investor confidence. On prediction market Myriad, expectations about Bitcoin’s near-term trajectory have shifted dramatically. Traders now see a 46% chance that Bitcoin will hit $115,000 before it reaches $85,000, down sharply from 71% just days earlier.
“Judging by market movements over the past three months, we must conclude that we are currently in a bear market,” said Adam Chu, chief researcher at options analytics platform GreeksLive. Chu added that “put options have now gained the upper hand following Bitcoin’s breach below the $100,000 mark today.”
Another blow to sentiment comes from the latest on-chain metrics. “CryptoQuant’s Bull Score is lighting up bear market territory: 8 out of 10 key on-chain metrics are bearish,” analyst Maarten Regterschot said in a note. He pointed to falling stablecoin liquidity, slowing network activity, and capital leaving derivatives markets, conditions similar to those seen at the end of 2021 and early 2022.
Perpetual futures markets echo the same trend. Open interest has been climbing since the $19 billion liquidation event on October 10, suggesting speculation is increasing even as cumulative volume delta continues declining. The drop signals that sellers are firmly in control. Velo data shows that short sellers currently dominate perpetual markets.
Meanwhile, the Coinbase premium, an indicator tracking price differences between the U.S. and global crypto markets, has turned negative, hinting at fading U.S. demand. Institutional appetite has also cooled, reflected in large exchange-traded fund outflows and declining treasury-driven accumulation among corporate buyers.
Even though geopolitical and macro uncertainties have eased somewhat, analysts say traders remain focused “on the damage already done,” including weeks of missing economic data.
Together, these pressures have contributed to what is emerging as one of the toughest fourth-quarter performances for crypto in recent years.
Intensifying Sell Pressure and the Emergence of Bearish Technical Signals
The ongoing decline has brought several bearish technical signals into focus, including the formation of a “death cross”, a well-known indicator that appears when the 50-day simple moving average crosses below the 200-day simple moving average. The pattern is seen by many as a sign that downward momentum is overtaking long-term strength.
“It’s less about calling tops and bottoms and more about recognizing that crypto is transitioning from an overheated environment into a more measured one,” said Shivam Thakral, CEO of BuyUCoin. He described the current downturn as a “corrective phase within a broader cycle,” while emphasizing that upcoming economic data, regulatory progress, and Bitcoin’s own on-chain activity could determine whether this correction becomes a deeper bear market.
Bitcoin’s technical landscape has weakened rapidly in recent days. The asset slipped below $97,000 on Friday, extending losses to more than 7% for the week. Institutional pressure has contributed heavily to the decline, with spot Bitcoin ETFs recording $622.70 million in net outflows so far this week. Thursday alone saw $869.86 million in withdrawals, the largest single-day outflow since February 25. If this pace continues, it may signal that institutional confidence is eroding more quickly than expected.
The selloff accelerated long-liquidation cascades. Roughly $920 million of Bitcoin positions were liquidated this week, including $749.75 million in long positions. Over the past 24 hours, 249,599 traders were liquidated for a combined loss of more than $1.11 billion, with more than 88% of positions skewed long. The largest single liquidation occurred on HTX, a BTC-USDT position worth $44.29 million.
The Fear and Greed Index’s move down to 16 reflects this growing anxiety. CryptoQuant’s weekly report highlights that Bitcoin’s Bull Score Index has fallen from 80, its reading on October 6 during Bitcoin’s record high, to 20 as the price fell under $100,000. The index first indicated bearish conditions on October 10, the same day Bitcoin closed at $113,000 after the “Big Liquidation” event. The report attributes much of the shift to fading momentum, weakening spot demand, and stagnating stablecoin liquidity.
One of the more striking developments is the behavior of long-term holders. Over the past 30 days, these holders have sold 815,000 BTC, the highest level since January 2024. Most of these sales occurred around $118,000 and $121,000. Historically, such selling has been accompanied by strong demand that absorbs supply. But this time, weakening ETF flows and a negative Coinbase premium mean the market is struggling to offset the pressure.
The report notes that the 365-day moving average around $102,000 has been a key support level this cycle. Bitcoin has closed below this level several times in recent weeks, something that had not occurred earlier in the bull run. If BTC fails to reclaim this support, analysts warn that the next key levels sit at $91,000 and then $72,000.
Technical indicators across multiple timeframes echo the same concerns. Bitcoin’s weekly chart shows a more than 20% decline from its peak, with prices trending under the 50-week exponential moving average at $100,862. A breach of this level could open the door toward the 100-week EMA at $85,508.
Momentum readings also favor the downside. The weekly RSI has dipped to 41, falling below neutral, while the MACD continues to show a strong bearish crossover with increasing red histogram bars. On the daily chart, Bitcoin faced sharp rejection at the 38.2% Fibonacci retracement level at $106,453 before sliding nearly 6% by Thursday.
If Bitcoin breaks below support at $97,460, it could fall toward the 61.8% retracement level around $94,253. The daily RSI at 32 signals that momentum is firmly bearish, and the MACD’s downward crossover supports this trend.
Structural Weakness Emerges as Analysts Point to $93,000 as a Critical Battleground
A growing body of research suggests the current downturn reflects more than a short-term correction. According to 10x Research, several of Bitcoin’s structural pillars, including ETF demand, realized profitability, and long-term holder behavior, now indicate the market has transitioned into a bear regime.
Their models, which began flashing warnings in mid-October, signal that sentiment is deteriorating beneath the surface even as volatility masks the trend. The group identifies $93,000 as the next critical level. If that threshold fails, they estimate that Bitcoin could fall toward its True Market Mean Price near $82,200, where most active coins would shift from profit into loss.
Market participants are becoming increasingly cautious. “Bitcoin was already under pressure from heavy spot selling and corporate-hedging activity, with traders avoiding altcoins almost entirely,” said Jake Ostrovskis, head of OTC trading at Wintermute. “When crypto-specific narratives thin out, correlations to traditional assets increase.”
Long-term holders, who had been absorbing supply for months, have now turned into net sellers. On-chain indicators like Coin Days Destroyed show older coins moving at a meaningful pace, suggesting strategic profit-taking rather than panic. Historically, this phase often marks the transition from a late-stage bull market into an early bear market.
Profitability metrics across several investor cohorts have also weakened, falling below neutral for the first time in months. While the broader market remains technically in profit, the rate of profit erosion is accelerating. Similar conditions have preceded major drawdowns in previous cycles.
A notable shift has also emerged in institutional behavior. Throughout 2024 and early 2025, spot ETF inflows acted as a stabilizing force during downturns. But that cushion has weakened significantly. Retail momentum, typically the final driver that pushes Bitcoin to blow-off tops, has also been absent in recent weeks. Without fresh buyers, the market is increasingly reliant on institutional demand to hold current levels.
Analyst Ki Young Ju of CryptoQuant highlighted that investors who entered Bitcoin in the past 6–12 months have an average cost basis near $94,000, making the $93,000 to $94,000 zone an essential psychological and structural support.
One unexpected development this week was confirmation from the SEC that it is working with lawmakers on comprehensive Bitcoin and crypto market structure legislation, with hopes of passing it before year-end. Such an announcement would typically serve as a bullish catalyst. But the risk-off environment muted its impact, illustrating how macro concerns now overshadow crypto-specific progress.
Despite the grim short-term tone, analysts emphasize that Bitcoin is not entering a prolonged bear winter like those of 2018 or 2022. A more mature investor landscape could make downturns shorter and less severe. If Bitcoin manages to hold above $93,000, a long consolidation period could follow. If it fails, a final capitulation move into the low $80,000s may unfold, which historically has created strong long-term buying opportunities.
At the time of writing, Bitcoin trades at $96,693.82, down 6.20% in the past 24 hours and 3.70% on the week. With prices edging closer to the crucial $93,000 support zone, investors are watching closely for the next major catalyst that could determine whether the market stabilizes or continues its slide toward deeper bearish territory.