Ethereum Could Replicate BNB’s Bullish Breakout Rally, XRP Faces Stronger Correction

BNB has been the standout performer over the last few weeks, forming multiple all-time highs en route to its peak of $1,330. A popular crypto analyst and trader has pointed out that the Ethereum price chart looks very similar to that of BNB before its breakout.
If the Ethereum price breaks above $5,000, it could follow a similar trajectory to BNB and peak as high as $9,200. On the flip side, the XRP price chart is looking more bearish than other altcoins. The Veteran trader Peter Brandt says he is waiting for a bearish confirmation to short XRP.
Ethereum To See BNB-Style Breakout Rally
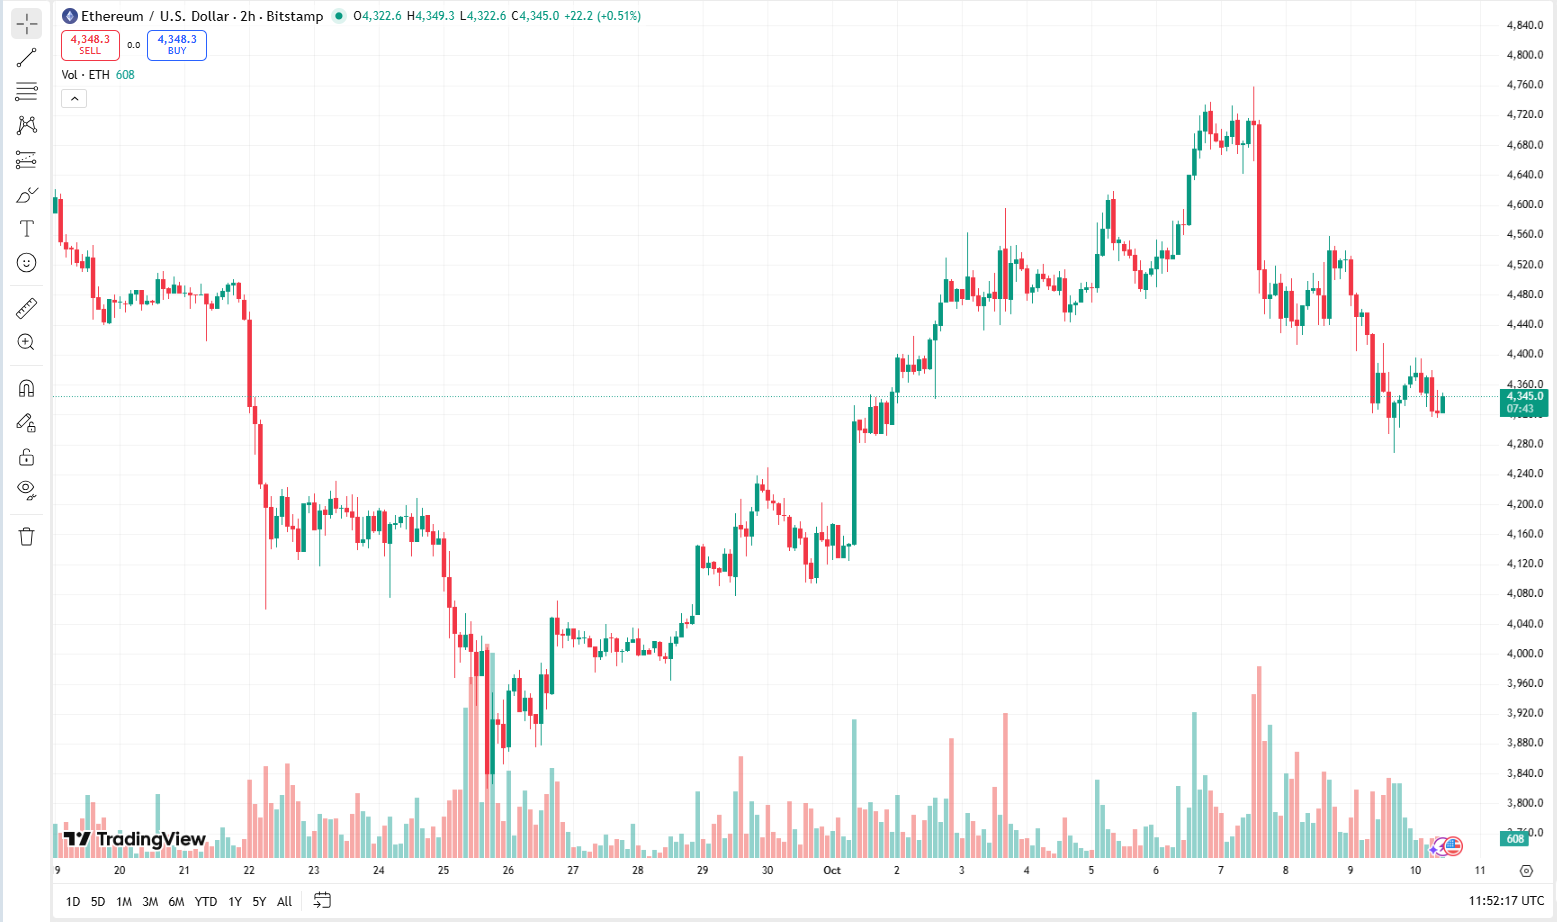
After being rejected at the resistance of $4,700, the Ethereum price has experienced a massive correction. Since its correction, Ethereum has dropped by nearly 10 percent, and it currently trades at around the $4,340 level, as per TradingView.
Despite the current outlook of Ethereum, the popular crypto analyst and trader, CryptoBullet, has drawn similarities between the current ETH price chart and BNB before the breakout rally that took its price to its current ATH of $1,330.
On the 1W timeframe, the Ethereum price chart has been consolidating between $1,000 and $4,800. BNB experienced a similar consolidation before its breakout rally that almost doubled its price. And like BNB, the ETH price is at the higher end of the consolidation, hinting that the breakout could happen soon.
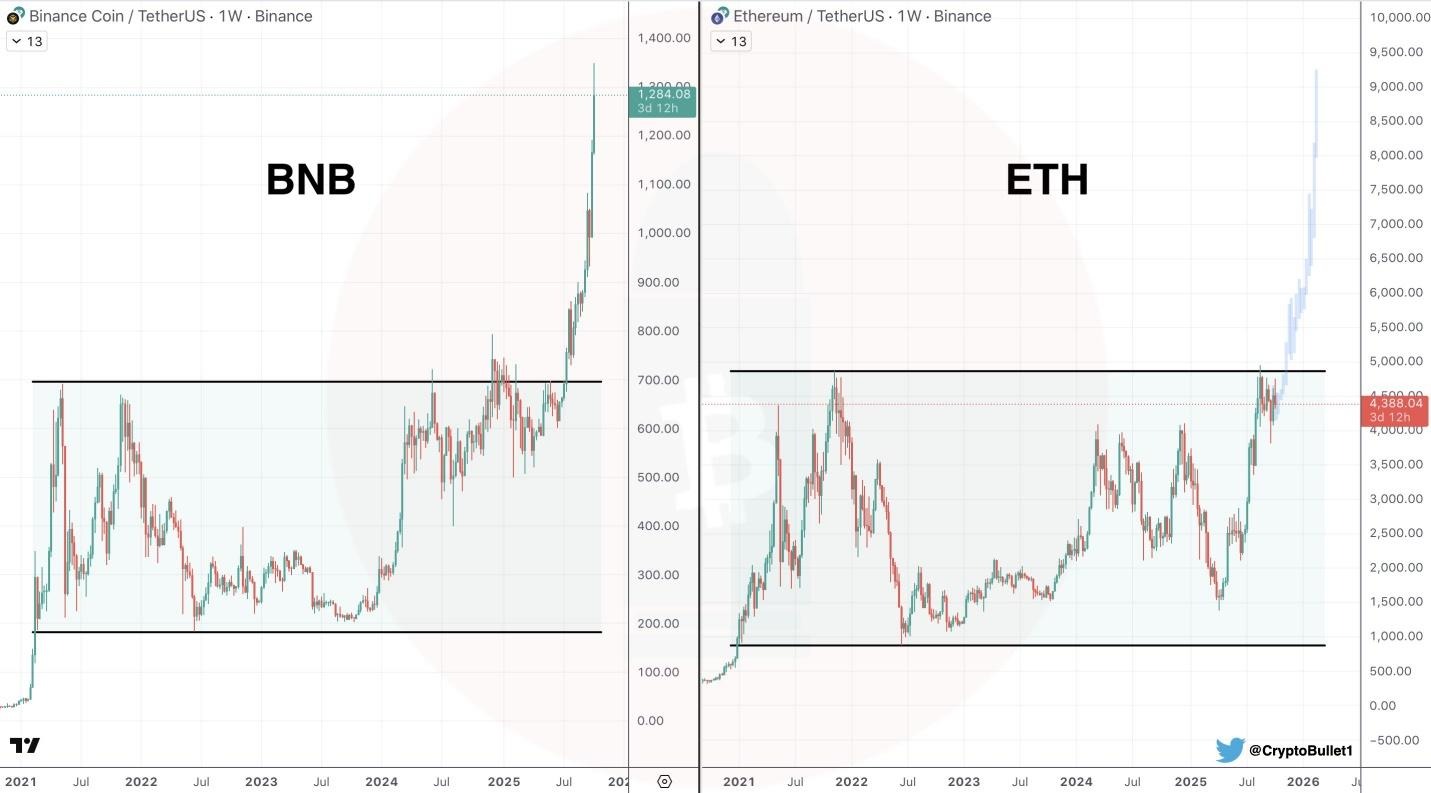
According to the analysis that CryptoBullet shared, the Ethereum price rallying above $4,800-$5,000 will kickstart the rally into price discovery. When this happens, the analyst suggests that the Ethereum price could reach highs of $9,250.
XRP Faces Bearish Pressure With Strong Correction in Sight
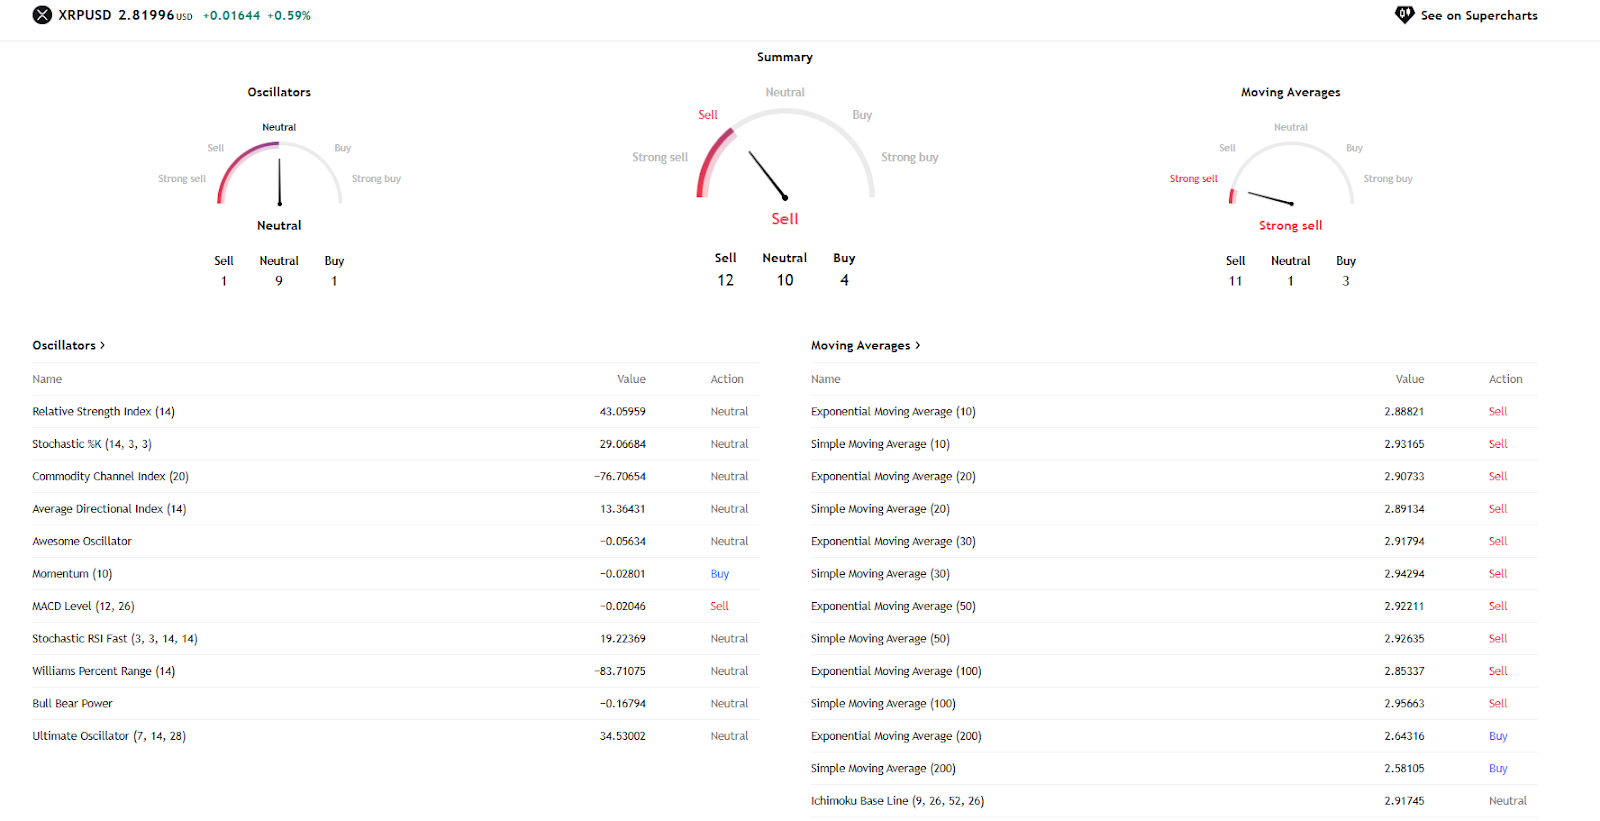
Since July, when the XRP price faced a rejection at $3.66, it has been losing bullish momentum, gradually dropping in price. The price of XRP has now dropped to the $2.80 support level, but most of its technical indicators on the 1D timeframe are neutral-bearish.
The veteran crypto trader, Peter Brandt, has highlighted that XRP has been in a descending triangle pattern. He adds that XRP is at the resistance neckline of the structure and could be completing the bearish formation soon.
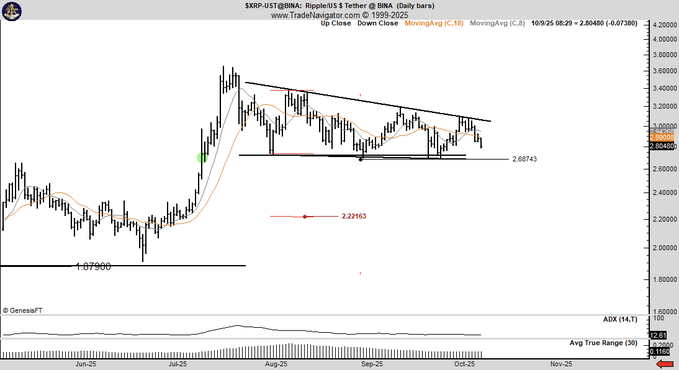
According to the trader, if this formation is complete and the XRP price closes below $2.66, it would mark an even bigger price breakdown. According to his analysis, the target for this breakdown is a retest of the July lows at $2.22. This represents a 21% correction from XRP’s current market price of $2.81.
While these are the personal sentiments from the veteran trader, they reflect some of the sentiment in the market, given the continuous price drops XRP has suffered in recent weeks. However, analysts like Degen_Hardy expect the XRP price to rebound from the lower end of the descending triangle pattern.
In Summary
While the short-term picture paints a bearish picture, the 1W timeframe shows that the much-expected Ethereum price pump is still in play. In the case of XRP, traders and investors would need to monitor the price level at $2.66. Any drop under this support might signify a further drop in price, and in the event of a recovery, XRP may rally to the $3 resistance.


