Indicators Hint That the Bitcoin Bottom is in, While Cardano Eyes Parabolic Rally

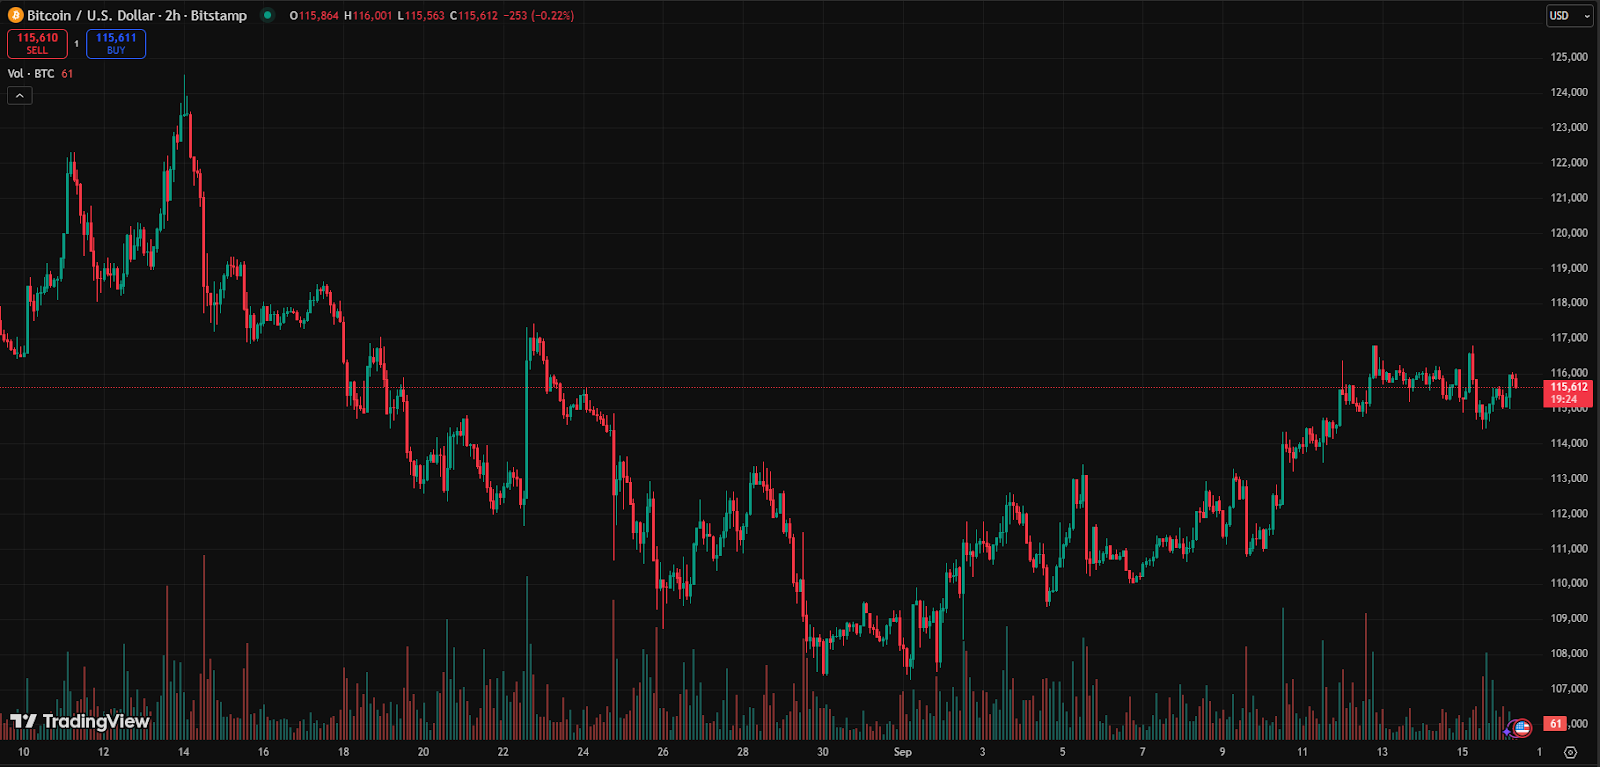
The Bitcoin (BTC) price has been trading in a tight range since reaching its current all-time high of $124,128 in August. Now, indicators like the sell-side risk ratio and scarcity index point to a potential bottom, with analysts suggesting that BTC could set a higher ATH before the end of 2025.
For Cardano (ADA), analysts believe that a parabolic rally could break out soon. Ali_Chart explains that Cardano could be repeating its last cycle’s pattern, with a potential to rally above $5.5 for a new ATH.
Bitcoin (BTC) Indicators Point To a Bitcoin Bottom and Imminent Rally
Since Bitcoin hit $124,128 on August 14, it has dropped to the $107,000 range, before consolidating in the $110k-$117k range. While the Bitcoin price has stagnated in the last few weeks, multiple indicators now point to a potential bottom.
According to data from Glassnode, the Sell-Side Risk Ratio of Bitcoin has dropped below 0.1%. A drop to this low means that Bitcoin has found a local bottom, is in an accumulation phase, and is experiencing low selling pressure.
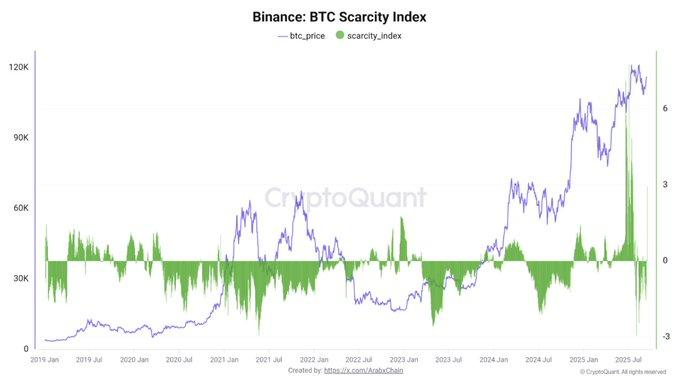
Similarly, CryptoQuant’s data shows that the Bitcoin Scarcity Index on Binance has jumped for the first time since June. This index only jumps when investors’ buying power exceeds available supply, showing a rush to acquire Bitcoin on the market.
In addition, investors and traders believe that the Bitcoin price could extend its bull run in 2025. A recent survey conducted by CoinGecko indicates that 86.7 percent of the crypto community agrees that Bitcoin will rise above its current ATH before the end of 2025.
40.1 percent think that Bitcoin will hit a high of between $125,000 and $150,000 this year, and 14.9 percent predict that the leading crypto will trade above $200,000.
Cardano (ADA) Could Explode With Bullish Pattern
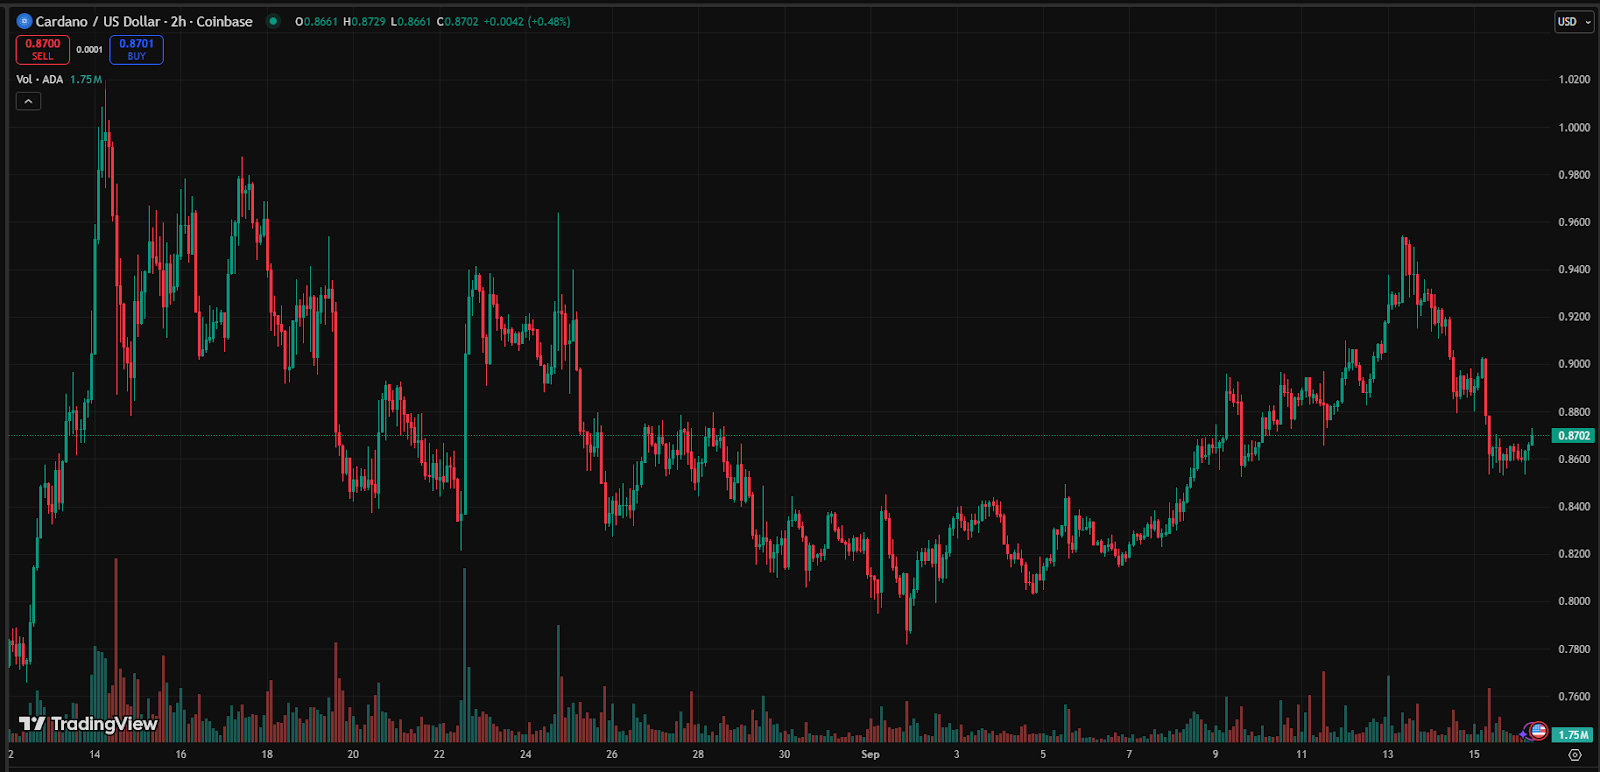
Cardano has underperformed most top crypto coins in recent weeks, struggling under the $1 resistance. Over the last month, the Cardano price has been consolidating between the $0.80 and $1.0 range.
However, it has captured the attention of analysts because of the appearance of a very bullish formation. Kamran Asghar has explained that the Cardano price is at a pivotal point on its weekly chart. The analyst explained in a post on X that Cardano is reaching the end of a multi-year accumulation pattern, which could end in a new parabolic run.
When this happens, Kamran expects ADA to rally above its current ATH. Ali_Charts, another popular crypto chartist on X, also explained that Cardano looks to be repeating its last cycle’s pattern.
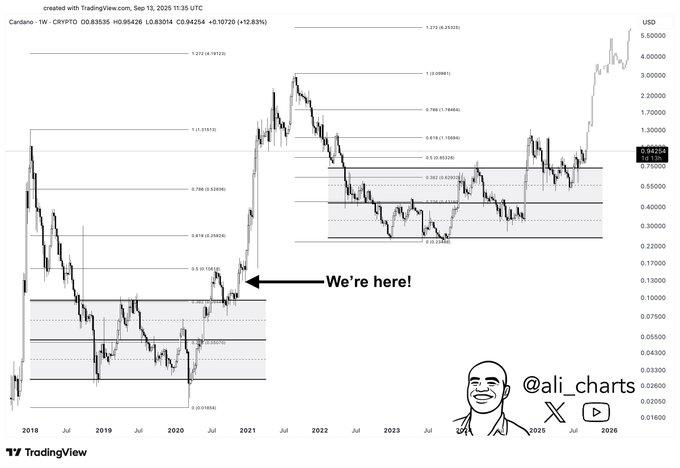
The analyst explains that if Cardano completely plays out its last bull cycle, then its rally is only just beginning. According to Ali_Charts, the Cardano price could go on to rally as high as $5.5, an increase of more than 6.2x from its current range.
What This Means for Investors
The bullish indicators for Bitcoin give investors and traders a possible entry opportunity before it extends its rally in this bull cycle. Meanwhile, Cardano’s robust rally could potentially gain momentum from Bitcoin’s rally or the highly anticipated launch of a Cardano ETF.