XRP Price Drops 11% In A Month Even As XRP ETFs Rack Up 30 Days Of Inflows

The XRP price dropped 11% over the past month and a fraction of a percent over the past 24 hours to trade at $1.99 as of 4:48 a.m. EST on trading volume that rose 55% to $1.9 billion.
This comes after US-listed spot XRP ETFs (exchange-traded funds) recorded 30 consecutive days of net inflows since their launch on November 13.
In contrast, Bitcoin and Ethereum ETFs have bled funds during the same period.
Data from SoSoValue shows that XRP ETFs, including Canary’s XRPC, Franklin Templeton’s XRPZ, Bitwise’s XRP, 21Shares’ TOXR, and Grayscale’s GXRP, have attracted fresh capital every trading day since launch.
Total net assets across the products climbed to roughly $1.18 billion, making it the first non-BTC, non-ETH crypto ETF cluster in the US to scale past the $1 billion mark, and in just a few weeks.
The flows into XRP ETFs shows interest from investors seeking differentiated crypto exposure within regulated products.
But the XRP price has fallen despite the inflows, and is trading in a tight range between $1.9 and $2.20, struggling to break above near-term resistance.
Will the XRP price recover or sustain its monthly downtrend?
XRP Price Under Pressure As Correction Extends, But Breakout Setup Emerges
The XRP price on the XRP/USD analysis on the 3-day chart has entered a sustained corrective phase after reaching a cycle high near $3.66, trading within a falling wedge pattern.
The downtrend was reinforced by a strong supply zone around $3.25, where multiple rejection wicks formed after the price failed to hold above key Fibonacci retracement levels.
Despite the continued decline, bulls appear to be defending the $1.95–$2.00 demand zone, allowing the Ripple token price to stabilize above the 200-day Simple Moving Average (SMA) at $1.82.
However, the 50-day SMA is serving as a long-term resistance zone at $2.622.
Meanwhile, the Relative Strength Index (RSI) is hovering near 36, below the neutral 50 level, and indicating that bearish momentum is still present. However, the RSI is no longer in overbought territory and is showing signs of stabilization, which may signal seller exhaustion if support holds.
Additionally, the Average Directional Index (ADX) is elevated near 39, confirming that the ongoing trend remains strong. This suggests that any breakout, whether bullish or bearish, is likely to be decisive.
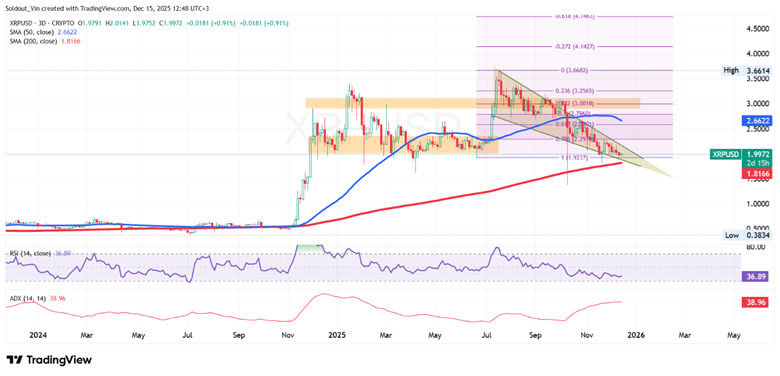
XRP/USD Chart Analysis: Tradingview
Ripple Token Price Outlook
Based on the XRP/USD chart analysis, the Ripple token price is approaching a critical decision zone within the falling wedge pattern.
If bulls manage to hold above the $1.95–$1.82 support region and push price above the upper boundary of the wedge, XRP could attempt a recovery toward the 50-day SMA near $2.60, followed by a move into the $2.95–$3.05 resistance zone.
Conversely, if bearish pressure intensifies and the price of XRP breaks below the 200-day SMA, the next downside targets lie around $1.65, with further support near $1.50, a level that previously acted as a strong accumulation zone during the prior consolidation phase.


