XRP Price Drops 2% Even As Vanguard Adds Ripple Token, Other Cryptos Today

The XRP price tumbled down 2% in the past 24 hours to trade at $2.01 as of 4:59 a.m. EST on trading volume that rose 5% to $3.9 billion.
This comes despite $11 trillion fund management titan Vanguard doing a U-turn to open its platform to crypto-focused ETFs (exchange-traded funds) and mutual funds holding digital assets.
Starting today, the firm will permit trading in funds including those that hold Bitcoin, Ethereum, XRP, and Solana.
This move will give more than 50 million customers access to regulated crypto wrappers across the US fund industry.
Separately, Bitcoin spot ETFs saw a total net inflow of $8.48 million on Dec. 1, marking four consecutive days of inflows. Ethereum spot ETFs recorded a net outflow of $79.06 million, ending a five-day inflow streak.
XRP spot ETFs posted $89.65 million in net inflows, while Solana spot ETFs saw $13.55 million in net outflows, according to SoSoValue data.
XRP Price Under Strong Pressure
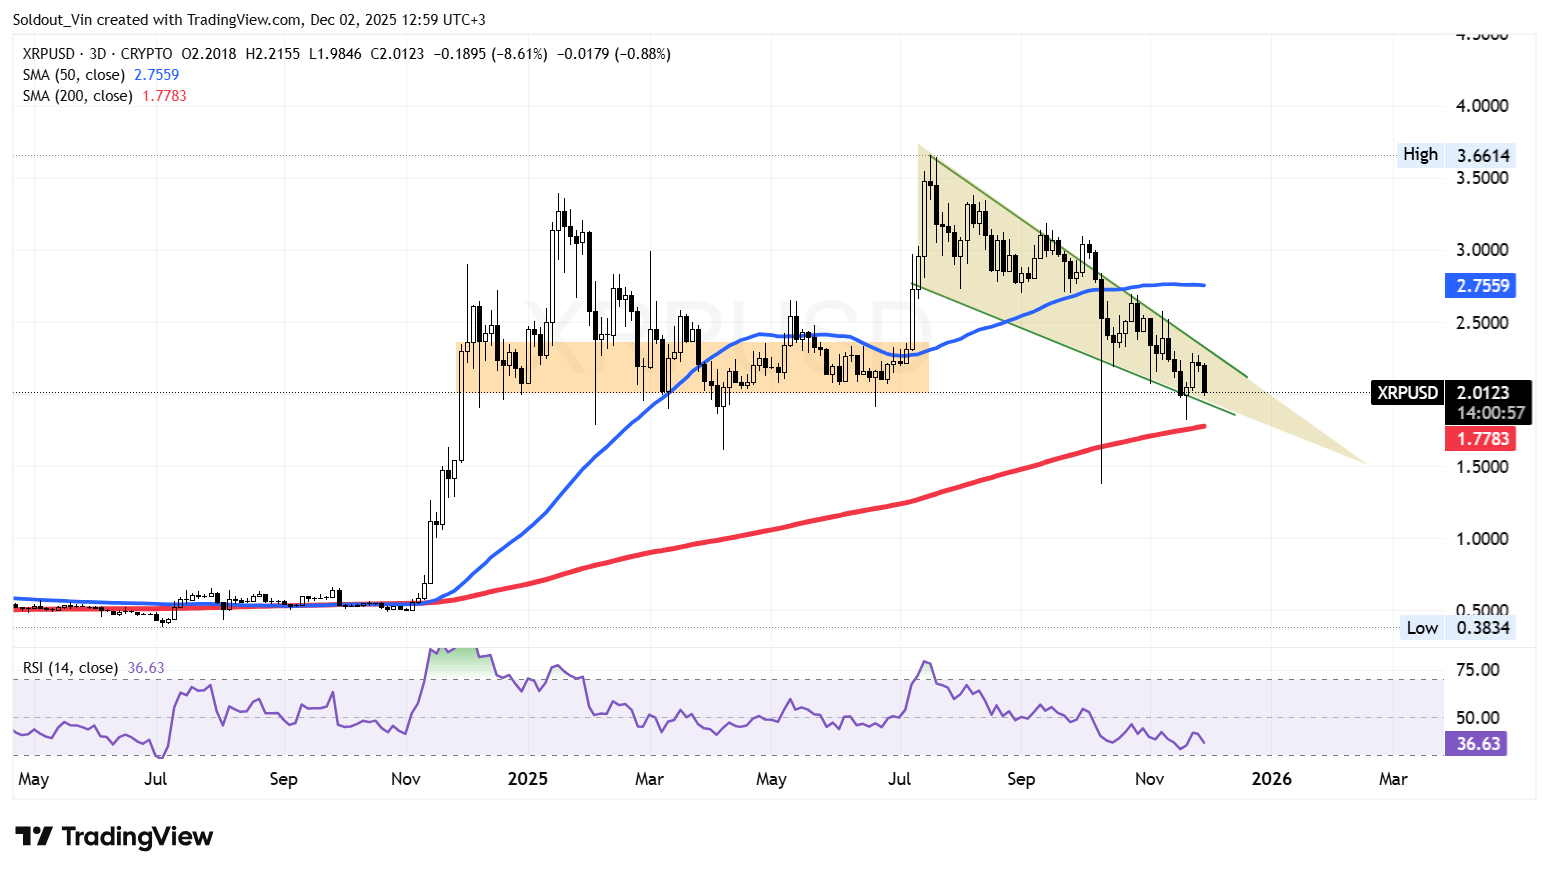
According to the XRP/USD chart on the 3-day timeframe, the XRP price is currently in a precise bearish correction, with multiple technical indicators confirming a weakening trend.
After a powerful rally in mid-2025 that pushed the Ripple token price toward $3.66, bullish momentum faded, and the market entered a prolonged downtrend within a falling wedge pattern.
After reaching its ATH, XRP began forming successive lower highs, indicating that sellers took control. The price of XRP then slipped back into the prior consolidation area between $1.90 and $2.20.
As a result of the downtrend, the price of the Ripple token fell below the 50-day Simple Moving Average (SMA) ($2.75).
However, the 200-day SMA still supports the price below at $1.77.
Meanwhile, the Relative Strength Index (RSI) on the 3-day timeframe is currently near 36, trending downward toward oversold territory. This indicates persistent bearish momentum and highlights that sellers remain in control.
Ripple Token Price Prediction
If bearish pressure continues and the XRP price breaks below wedge support and the 200-day SMA, the next possible support region could emerge near the $1.50 area, a level that aligns with wedge projections and previous reaction zones.
Conversely, if buyers step in near oversold RSI levels, the Ripple token may attempt a rebound toward the wedge’s upper resistance. Only a breakout above that upper trendline, followed by a retest of the 50-day SMA, would suggest the beginning of a bullish reversal, as XRP targets prices above $3.
Crypto analyst Ali Martinez suggests that the TD Sequential indicator has printed a buy signal, which may signal the start of a bullish trend as buyers step in.
Until then, XRP remains firmly within a corrective bearish phase.


