XRP Price Falls Even As First XRP ETF Listing Looms Tomorrow
The XRP price dropped 1.7% in the past 24 hours to trade at $2.41 as of 4:47 a.m. EST on trading volume that plunged 31% to $3.7 billion.
This comes as Canary Capital’s XRP ETF (exchange-traded fund) looks set to become the first pure spot XRP ETF to list in the US tomorrow.
That after the firm filed a Form 8-A with the US Securities and Exchange Commission (SEC) on Monday evening, which Bloomberg ETF analyst Eric Balchunas said points to launch yesterday or today.
Balchunas believes that the timing of the filing mirrors the process seen with Hedera (HBAR) ETFs, which went live the day after their 8A forms were lodged.
A successful ETF launch could expand XRP’s liquidity base and potentially trigger inflows from registered investment advisers.
XRP Price Holds Steady Above Key Support, Eyes Recovery
After facing strong resistance near $3.25 earlier in the 3rd quarter, the XRP price has entered a consolidation phase, stabilizing above the crucial $2.30–$2.10 support zone.
This level aligns with the 0.786 Fibonacci retracement and the lower boundary of a descending channel, providing a potential foundation for a short-term bullish reversal.
Currently, the Ripple token price trades around $2.42, while the 50-day Simple Moving Average (SMA) sits near $2.58 and the 200-day SMA hovers at $2.63. This trend shows that the price of XRP still sits below both the SMAs, as evident in the falling channel pattern.
Meanwhile, the Relative Strength Index (RSI) is at 48.33, just below the neutral 50 mark. This indicates that bearish momentum has eased, but bulls have yet to regain control fully.
In addition, the Moving Average Convergence Divergence (MACD) has started to turn positive, with the blue MACD line crossing above the orange signal line. The histogram has flipped into green territory, reflecting the early stages of a possible bullish momentum shift.
On the Fibonacci retracement chart, the 0.618 level at $2.59 acts as a critical resistance barrier, closely aligning with the 50-day SMA.
A successful breakout above this zone could open the path toward the 0.5 level at $2.80, followed by $3.00 (0.382 Fib). On the downside, immediate support lies at $2.31 (0.786 Fib), with a stronger floor near $1.94 if bearish pressure intensifies.
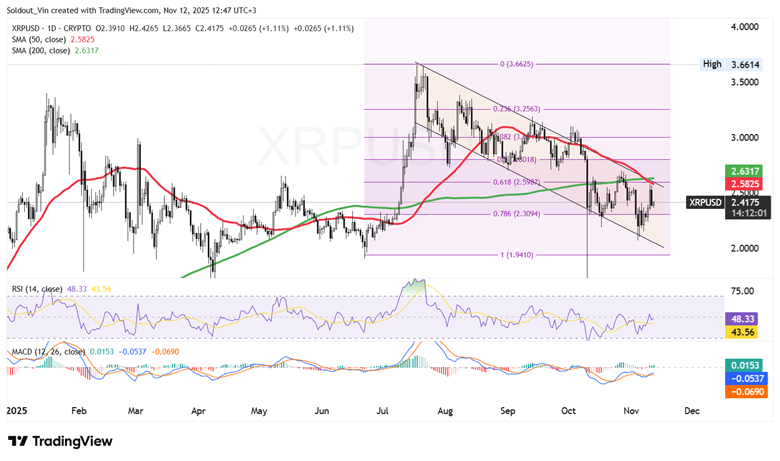
XRP/USD Chart Analysis: TradingView
XRP Targets Rebound Toward $2.80 And Above
Based on the XRP/USD analysis on the daily chart, the XRP price is forming a base near the $2.30 region. The alignment of Fibonacci supports, a potential bullish MACD crossover, and stabilizing RSI levels hint at a possible recovery phase.
If the price of XRP sustains above $2.30 and manages to reclaim the 50-day SMA ($2.58), the next upside targets could emerge at $2.80 and $3.00. A confirmed breakout above the 200-day SMA ($2.63) would further validate a short-term trend reversal.
Conversely, a daily close below $2.30 would weaken the bullish scenario for the price of the Ripple token and expose the pair to deeper retracements toward $1.94, marking a full retest of the Fibonacci base.


