XRP Price Prediction: Ripple Token Tumbles 6.5% Despite Singapore Payments Expansion Nod
The XRP price fell 6.5% in the past 24 hours to trade at $2.04 as of 4:27 a.m. EST on trading volume that skyrocketed 86% to $3.6 billion.
This comes even after Ripple announced that Singapore’s central bank approved an expanded set of payment services for its Singapore subsidiary.
That is seen as a means to strengthen the firm’s ability to continue investing in the country. Additionally, it paves the way for building the infrastructure that financial institutions need to move money efficiently, quickly, and safely.
Meanwhile, Ripple Senior Executive Officer and Managing Director for the Middle East and Africa Reece Merrick said that crypto, including Ripple USD stablecoin (RLUSD), could reshape payment costs in a way similar to how internet messaging disrupted SMS services.
According to Merrick, blockchain-based settlement could reduce costs and accelerate value transfer across borders, which echoes how data-driven messaging overtook SMS.
Despite that news, the Ripple token price was dragged down by an overall market correction. The crypto market cap overall plunged 5% in the last 24 hours to a market capitalization of $3.02 trillion as Bitcoin fell near to $86k.
Will the bearish trend continue, or will XRP recover?
XRP Price Breaches Support – Could Drop Further
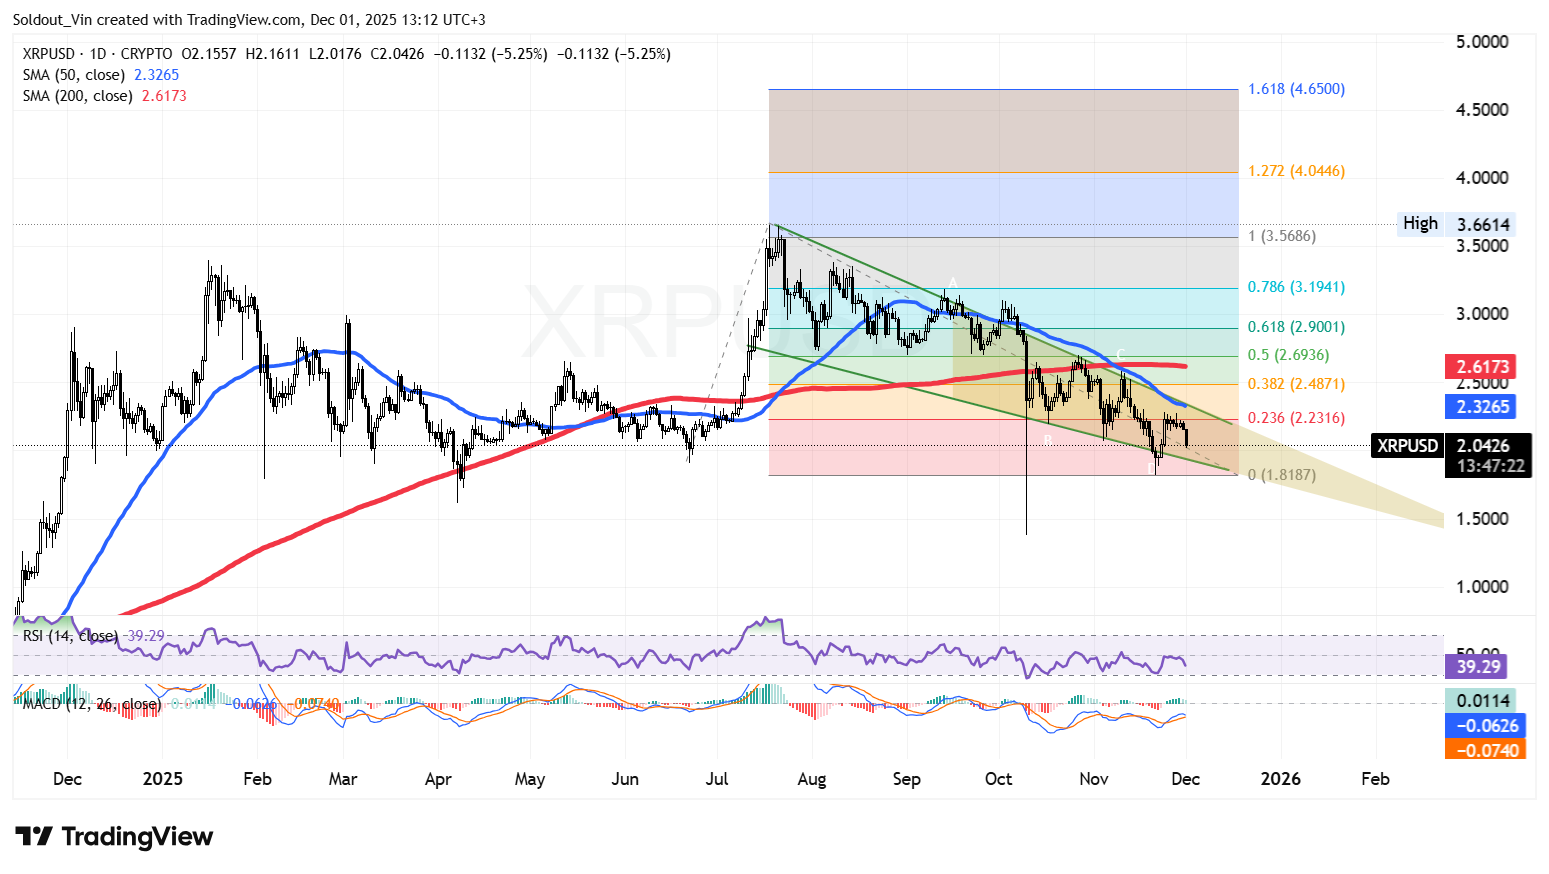
After trading within the $2.29 area for the better part of the first and second quarters, the XRP price went through a surge to break through several resistances.
This surge pushed the Ripple token price to $3.66, its all-time high (ATH).
However, after reaching this local high, the XRP price went through a sustained correction, which saw the bears take control. XRP has since traded within a well-defined falling wedge pattern. Despite multiple attempts, the price has been unable to break out of the wedge, as pressure between buyers and sellers intensifies within the confines of the pattern.
As a result, the price of XRP breaks down below key support levels on the Trend-based Fibonacci Retracement chart, and bears seem to have complete control of the asset as it continues to fall and after breaching the $2.23 zone on the 0.236 Fib level.
Meanwhile, the trend has resulted in the price of the Ripple token falling below both the 50-day and 200-day Simple Moving Averages (SMAs), which cements the overall bearish sentiment.
The Relative Strength Index (RSI) is also retracing from the mid-levels, as it falls towards the 30-oversold line, currently at 39.
Ripple Token Price Prediction
According to the XRP/USD chart analysis on the daily timeframe, the XRP price is still on a bearish move.
The 50-day SMA has crossed below the 200-day SMA, forming a death cross at $2.62, which further fuels the bearish narrative.
If the price of the Ripple token continues to drop, the next key support zone is on the lower boundary of the falling wedge around $1.90. Sustained bearish pressure, and if the price falls below the wedge, the next key support is on the 0 Fib level ($1.818).
However, the Moving Average Convergence Divergence (MACD) has shifted to slightly positive, as the blue MACD line crosses above the orange signal line.
If bulls pick up on this momentum, the XRP could recover, with $2.69 (0.5 Fib level), which is a key resistance, acting as a short-term target.