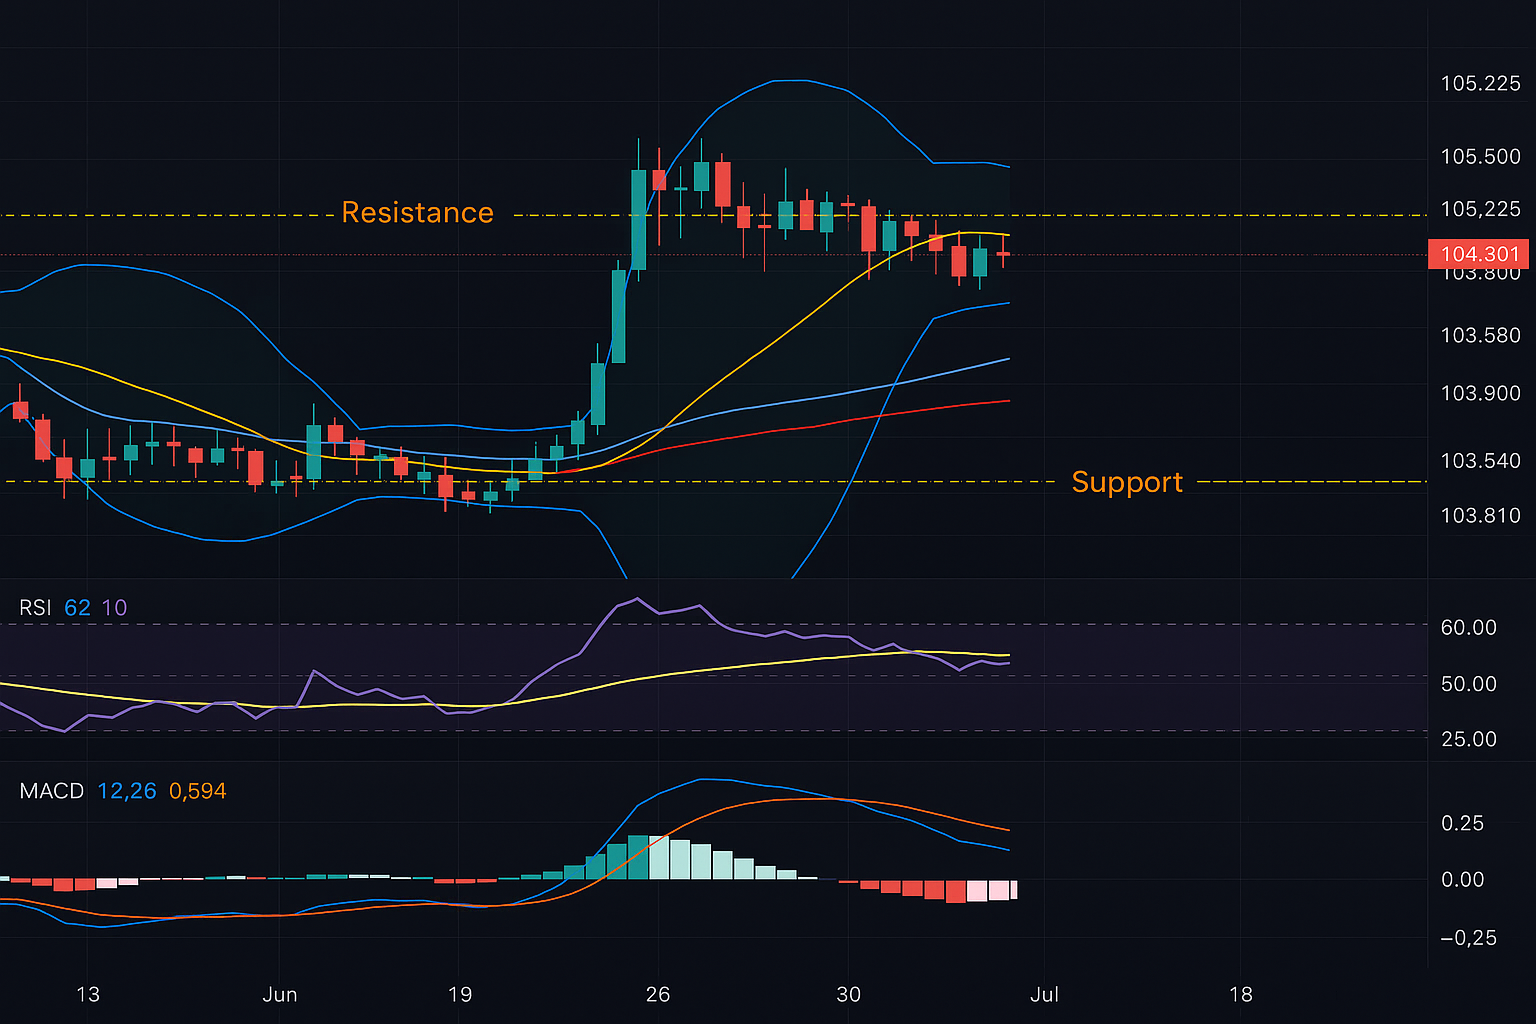
Bitcoin ($BTC) continues to trade steadily near the $104,391 mark, even as geopolitical tensions and cautious investor sentiment cloud the market.
Despite a slight daily dip, the leading cryptocurrency has maintained a relatively tight trading range, supported by consistent institutional inflows into spot Bitcoin ETFs.
The day before, on 18 June, spot Bitcoin ETFs recorded a robust inflow of $388.3 million. This marks the eighth consecutive day of positive flows, a trend that appears to be defying external shocks such as the recent conflict between Israel and Iran.
According to Farside Investors, the largest contributions came from BlackRock’s iShares Bitcoin Trust (IBIT), which pulled in $278.9 million, and Fidelity’s Wise Origin Bitcoin Fund (FBTC), which attracted another $104.4 million. Bitwise’s Bitcoin ETF (BITB) also registered a modest inflow of $11.3 million on the same day.
Other major ETF providers, including ARK Invest, Invesco, Franklin Templeton, Valkyrie, VanEck, and WisdomTree, did not record new flows during this period.
On the other hand, Grayscale’s Bitcoin Trust ETFs continued to experience outflows, with GBTC shedding $16.4 million and the Grayscale Bitcoin Mini Trust losing $10.1 million. This divergence underscores shifting investor preferences within the ETF space.
Despite the market’s earlier jitters caused by the Middle East conflict, Bitcoin’s price showed remarkable resilience, hovering near the $105,000 level throughout. On-chain analytics firm, Santiment, commented on the situation, noting that the price reaction resembled previous market responses to geopolitical upheavals.
“The price pattern reflected a ‘risk-off, then stabilise’ approach”, Santiment stated, drawing comparisons to reactions seen during the Russia-Ukraine conflict in February 2022 and the Israel-Palestine tensions in October 2023.
Since mid-April, spot Bitcoin ETFs have raised more than $11.2 billion in total inflows, with capital increasing on most trading days.
Among the eleven Bitcoin ETF products on the market, BlackRock and Fidelity dominate, with cumulative inflows of $50.6 billion and $11.5 billion, respectively.
These numbers also incorporate the substantial $23.2 billion outflow from Grayscale’s products, reflecting varying dynamics across providers.
Meanwhile, Ethereum ETFs in the United States have shown a similarly strong performance. After a brief pause on 13 June, inflows resumed over the following three days, including $19.1 million added on 18 June.
BlackRock’s iShares Ethereum Trust ETF (ETHA) leads the sector, having posted consistent gains and reported outflows on only two days since 20 May.
Analysts suggest that recent regulatory clarity has helped boost Ethereum’s appeal. The US Securities and Exchange Commission (SEC) has confirmed that Ethereum staking does not classify as a securities transaction, potentially paving the way for future Ethereum ETFs that include staking features.
Technical indicators signal market consolidation

While ETF inflows paint a picture of confidence, technical signals around Bitcoin suggest a market in wait-and-see mode. The daily Relative Strength Index (RSI) currently sits around 62, indicating moderate upward momentum without reaching overbought territory.
Traders appear cautiously optimistic, with indicators pointing to a neutral-to-bullish outlook but no definitive breakout.
Short-term moving averages (10-day, 20-day, and 30-day) show Bitcoin hovering just above or near their levels, reinforcing the sense of short-term stability.
However, longer-term moving averages, such as the 50-day and 100-day lines, are still being tested from below.
This has created some hesitation among technical traders, as Bitcoin has yet to firmly re-establish support above these longer averages.
The Moving Average Convergence Divergence (MACD) is also sending mixed signals. Positioned close to the zero line, it has not produced a strong bullish or bearish crossover, highlighting the lack of dominant momentum.
Popular technical analysis platform, TradingView, classifies Bitcoin’s moving average signals as a “strong sell” while keeping oscillator readings neutral.
Bollinger Bands, set at a 20-day average with two standard deviations, indicate that Bitcoin is currently trading between the midline and the upper band. This suggests moderate upward pressure within a stable range.
The upper Bollinger Band is positioned near $105,225, while the lower band lies around $103,819. Analysts note the absence of a volatility squeeze or a pronounced breakout, pointing to consolidation rather than impending price swings.
Support and resistance levels remain tightly clustered. Immediate support lies at around $105,451, with a more significant psychological floor located at $103,800. Should selling pressure intensify, Bitcoin may find its next support near $100,000 or, in more severe cases, around $95,000.
On the upside, resistance zones have been identified near $105,559, $105,592, and $105,646. A breakthrough of these could open the path toward a broader resistance region between $109,700 and $111,600 – levels that have historically posed challenges to Bitcoin’s price.
Overall, the technical landscape suggests Bitcoin is stuck in a consolidative phase, oscillating between $103,800 and $105,600. “It’s a waiting game”, one trader noted on TradingView. Until a significant move – either above $105,600 or below $103,800 – occurs, the market may continue to tread water.
Market sentiment hits lows, but contrarian signals emerge
Despite the stable price, sentiment around Bitcoin has dipped sharply. According to Santiment, social media chatter has taken a bearish turn, with negative comments slightly outnumbering positive ones for the first time in over two months. The sentiment ratio currently sits at 1.03 bearish takes for every bullish one.
Santiment interprets this as a contrarian indicator. “This is typically a bullish sign”, the firm noted, referencing similar situations in the past where negative sentiment preceded price recoveries.
One notable example came earlier this year when Bitcoin dropped below $75,000 amid fears of US tariffs imposed by the Trump administration. While social sentiment soured rapidly, the cryptocurrency rebounded soon after.
Market observer, Axel Adler Jr., commented on broader macro pressures weighing on traders. European equity markets opened lower in recent sessions, responding to growing concerns of US military involvement in the Middle East.
This geopolitical uncertainty, coupled with economic anxieties, is prompting investors to reassess riskier assets.
The Federal Reserve added to this uncertainty on 18 June by maintaining interest rates in the 4.25% to 4.5% range. The move was widely expected, but it came with a cautious tone. Fed officials raised their inflation forecast to 3% and cut their 2025 GDP outlook to 1.4%.
“With no urgency to cut rates, the Fed reiterated its ‘wait-and-see’ approach”, BRN lead analyst Valentin Fournier told The Block in an emailed comment.
Fed Chair, Jerome Powell, expressed optimism in a “disinflationary trend”, while noting ongoing strength in jobs and consumer spending. Market data from CME FedWatch now suggests a 62% probability of a rate cut in September, indicating some room for relief later in the year.
Despite this backdrop, Bitcoin’s price remains largely unmoved, showing a minimal 0.3% decline over the last 24 hours and a weekly loss of 2.8% – slightly underperforming the broader crypto market.
Some analysts, including Twitter user Ed_NL, warned that Bitcoin may still revisit lower support levels, potentially repeating last summer’s double correction pattern.
However, longer-term indicators remain supportive. Fidelity recently reported that dormant Bitcoin supply continues to grow, surpassing new issuance. This trend reflects strong conviction among long-term holders and complements the steady ETF inflows seen in recent weeks.
At the time of writing, Bitcoin is priced at approximately $104,300. Its current stability amidst mounting market tensions, cautious policy guidance, and souring sentiment highlights a curious paradox. While fear grips short-term traders, institutional interest remains undeterred.
As the digital asset sector navigates regulatory developments, geopolitical risks, and macroeconomic shifts, all eyes are on Bitcoin’s next move – and whether the current calm is a precursor to fresh momentum.


