A key index that gauges investor sentiment has suggested a pause in the recent bull run of the crypto market.
At the time of press, the Crypto Fear & Greed Index stood at a high of 71 as per data source alternative.me. This level was last seen in around October 2021.
The index ranges from 0 to 100 and places its analysis on emotions and sentiments from different sources to crunch them into one number. It uses several metrics, including market momentum, volatility, volume and social media, to figure out and measure market sentiment for Bitcoin and prominent alternative cryptocurrencies.
In the Fear & Greed Index, a value of 0 means “Extreme Fear” while a value of 100 represents ‘Extreme Greed’. Values between 50 and 74 signal ‘Greed’ while readings above 75 is a marker for the start of ‘Extreme Greed’.
The higher the score is on the index, the more confident investors are feeling about Bitcoin’s prospects. Compared to last month, when the index stood around 47-50 indicating a neutral sentiment, the market seemed to be at greed currently, with the index positioned at 72.
As observed before, traders prefer buying a cryptocurrency when the index flashes extreme fear. When it hits greed, they become cautious.
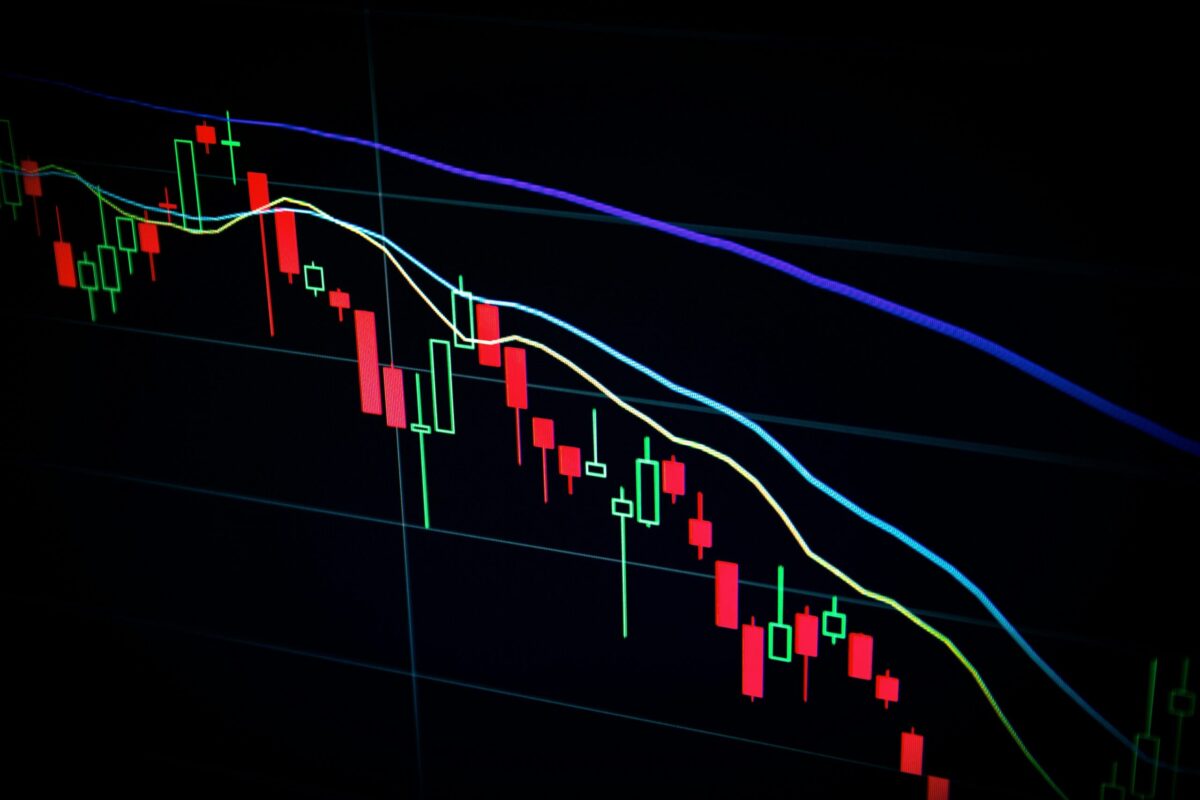
Therefore, analysts anticipated the top cryptocurrency to take a breather in its bullish run that made it achieve gains by over 20% in the last week. Another indicator, called the Relative Strength Index (RSI) also affirmed the same.
The RSI is a momentum indicator used in technical analysis which measures the speed and magnitude of an asset’s recent price changes. It then evaluates whether the asset is overvalued or undervalued in price. This is displayed as an oscillator on a scale of zero to 100.
Currently, the index stood above 70 which is the overbought region. Overbought readings on the RSI are often a warning for bull market breathers where the momentum slows down.
Bitcoin ($BTC), which recently hit a 17-month high above $35k in this bullish momentum, seemed to have slowed down at the time of writing too. Down by over 1% in the last hour, the coin is now changing hands for $34,220. However, it continued to trade in green on its charts, as it was still up by over 20% weekly.
The broader crypto market also showed similar movements, with the market capitalisation climbing down to $1.8trillion on the back of almost a 1% daily change. The recent push in bullish momentum was triggered by spot Bitcoin exchange-traded fund (ETF) speculations, taking the market’s capitalisation to surge to $1.3trn.