Introduction
We are currently witnessing a volatile period in the world of cryptocurrency. The latest trend involves Bitcoin, the leading cryptocurrency, taking a steep downward turn. But does this dip actually signal trouble, or could it be a mere precursor to a massive uptick? Let’s delve into this issue with the help of a leading analyst’s insights.
The Current Crypto Market Situation
Bitcoin Drops Below $29,000
It has been a tumultuous ride for Bitcoin, which recently saw its price fall to a six-week low of under $28,800. This dramatic drop followed a relatively quiet trading week, during which Bitcoin was mainly hovering around the $29,000 mark. The plunge happened during the Asian trading session, with the market cap retracting to $562 billion.
Altcoins Follow Suit
It’s no secret that altcoins often follow Bitcoin’s lead. In this case, they are also in the red. From ETH and Ripple to Dogecoin, Cardano, Polkadot, and Uniswap, most altcoins have registered a decline. In total, the crypto market cap has lost $20 billion from yesterday’s peak.
The Analyst’s Perspective
Bitcoin’s Relation with Global Liquidity Cycles
While this may seem like a doom-and-gloom situation, a renowned crypto analyst, TechDev, brings a different perspective to the table. He suggests that the key to understanding Bitcoin’s future might lie in global liquidity cycles. TechDev’s research pitting the Chinese 10-year bonds against the US dollar index provides some insight into this relation.
Implications for Bitcoin’s Future
When major central banks expand their balance sheets, global liquidity tends to rise. Interestingly, TechDev’s chart shows that Bitcoin’s trajectory tends to follow global liquidity closely. This might suggest that Bitcoin is primed for a swift price acceleration in the months to come.
The Potential Upside
The Logarithmic Growth Curve

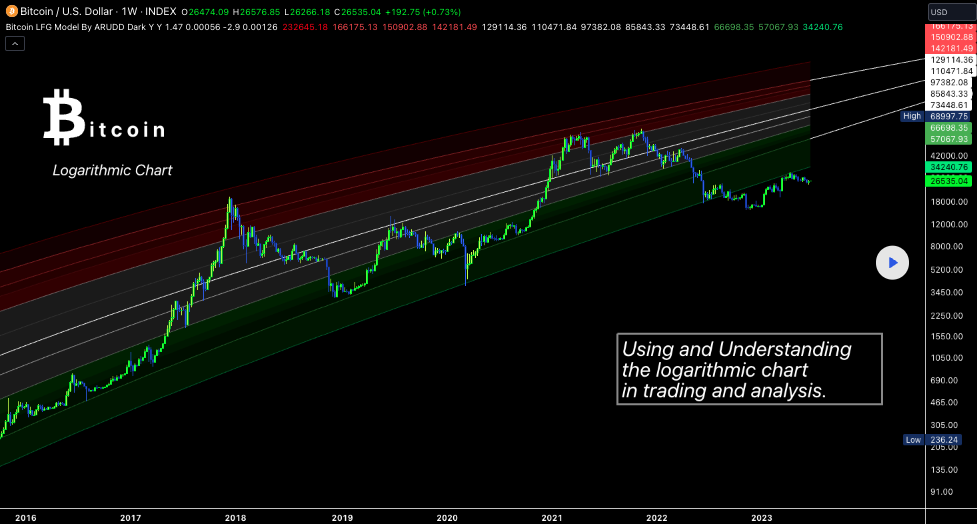
To understand Bitcoin’s potential for growth, TechDev refers to the Logarithmic Growth Curve (LGC). This tool is designed to estimate Bitcoin’s long-term highs and lows, disregarding short-term volatility.
Projected Price Range for Bitcoin
According to TechDev’s calculations, Bitcoin could reach between $100,000 and $140,000 based on the LGC parameters and impulse steepness. While this might seem optimistic, it could be possible if Bitcoin follows the path indicated by its relation to global liquidity cycles.
A Momentary Setback?
Bitcoin’s Recent Performance
At the time of writing, Bitcoin trades at $29,186, a 0.68% decline in the past 24 hours. However, the weekly performance shows a marginal increase of nearly 0.5%.
The Fall from All-Time High
Bitcoin is nearly 58% down from its all-time high of over $69,000, which it achieved in November 2021. This discrepancy may appear alarming, but according to the LGC and the global liquidity indicator, it could be a temporary setback.
Preparing for a Bull Market
The Altcoin Market Cap Chart
TechDev points out that the three-week altcoin market cap chart is at its tightest compression ever. This, combined with other indicators, could be signalling a potential upward trend.
Bitcoin’s Bollinger Bands Width
Another metric worth noting is the Bollinger Bands Width (BBW) for Bitcoin, which currently hovers slightly above 0.50. This relatively low level could signal an explosive move in either direction following a period of low volatility.
Conclusion
While the recent drop in Bitcoin’s price may seem alarming, a holistic view suggests that it could be a temporary phenomenon. By examining indicators like the LGC, global liquidity cycles, and BBW, we can anticipate significant potential for growth in the future.
FAQs
What is the current price of Bitcoin?
At the time of writing, the current price of Bitcoin is $28,922.
What is the relation between Bitcoin and global liquidity cycles?
Global liquidity cycles, as indicated by the aggregate major central bank balance sheet, tend to have a direct relation with Bitcoin’s trajectory.
What is the Logarithmic Growth Curve?
The Logarithmic Growth Curve (LGC) is a tool used to estimate Bitcoin’s long-term highs and lows, disregarding short-term volatility.
What is the predicted price range for Bitcoin according to TechDev?
TechDev predicts that Bitcoin could reach between $100,000 and $140,000 based on the LGC parameters and impulse steepness.
What is the Bollinger Bands Width (BBW)?
The BBW is a metric used by traders to signal an explosive move in either direction following a period of low volatility.


